

Adjusted Net Revenue up 33% year-over-year to a record $771 million
Adjusted EBITDA up 46% to a record $210 million
Fee-based Revenue up 67% to a record $315 million
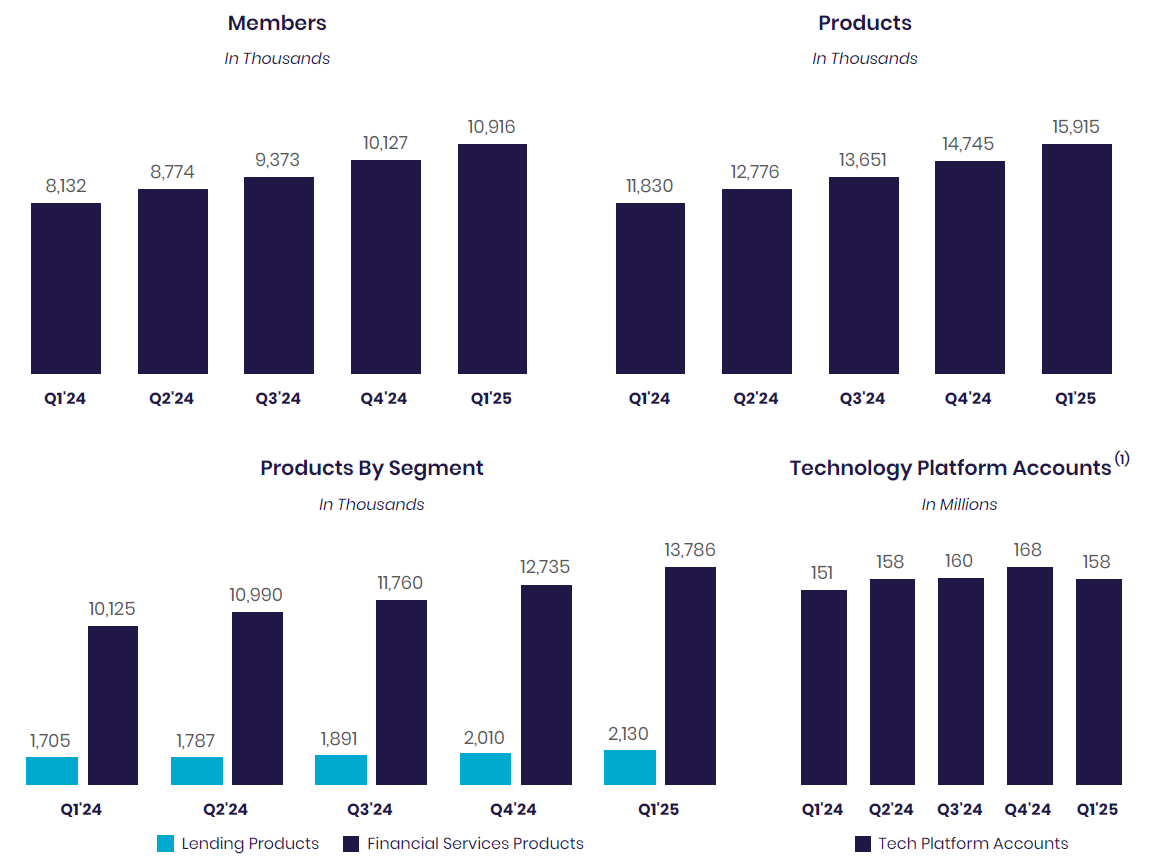
Member growth up 34% to a record 10.9 million members
Product growth up 35% to a record 15.9 million products
Management Raises 2025 Guidance
SAN FRANCISCO--(BUSINESS WIRE)--SoFi Technologies, Inc. (NASDAQ: SOFI), a member-centric, one-stop shop for digital financial services that helps members borrow, save, spend, invest and protect their money, reported financial results today for its first quarter ended March 31, 2025.
“We are off to a tremendous start in 2025. In Q1, we delivered durable growth and strong returns driven by our relentless focus on product innovation and brand building,” said Anthony Noto, CEO of SoFi. “We delivered our highest revenue growth rate in five quarters, driven by new records in members, products, and fee-based revenue. These results demonstrate the strength of SoFi's unique strategy, combination of businesses, and product architecture, which give us a sustainable competitive advantage with the highest lifetime value per member. This allows us to innovate unmatched products and services that help members spend less than they make and invest the rest so they can get their money right and realize their ambitions. With strong momentum in the first quarter, we are both accelerating our rate of innovation and increasing our financial guidance for 2025.”
Consolidated Results Summary
|
|
Three Months Ended March 31, |
|
% Change |
|||||||
($ in thousands, except per share amounts) |
|
|
2025 |
|
|
|
2024 |
|
|
||
Consolidated – GAAP |
|
|
|
|
|
|
|||||
Total net revenue |
|
$ |
771,759 |
|
$ |
644,995 |
|
20 |
% |
||
Net income |
|
|
71,116 |
|
|
|
88,043 |
|
|
(19 |
)% |
Net income attributable to common stockholders – diluted |
|
|
71,455 |
|
|
|
22,523 |
|
|
217 |
% |
Earnings per share attributable to common stockholders – diluted |
|
$ |
0.06 |
|
|
$ |
0.02 |
|
|
200 |
% |
Consolidated – Non-GAAP(1) |
|
|
|
|
|
|
|||||
Adjusted net revenue |
|
$ |
770,720 |
|
|
$ |
580,648 |
|
|
33 |
% |
Adjusted EBITDA |
|
|
210,337 |
|
|
|
144,385 |
|
|
46 |
% |
Adjusted net income |
|
|
71,116 |
|
|
|
88,043 |
|
|
(19 |
)% |
Adjusted net income attributable to common stockholders – diluted |
|
|
71,455 |
|
|
|
22,523 |
|
|
217 |
% |
Adjusted earnings per share – diluted |
|
$ |
0.06 |
|
|
$ |
0.02 |
|
|
200 |
% |
(1) |
|
For more information and reconciliations of these non-GAAP measures to the most comparable GAAP measures, see “Non-GAAP Financial Measures” and Table 2 to the “Financial Tables” herein. |
Product Highlights
- Set new records in members and products. A record 800,000 new members joined SoFi in the quarter, up 34% to 10.9 million. The company recorded 1.2 million new products, up 35% from the prior year to 15.9 million products.
- Doubled revenue in Financial Services through rapid innovation. SoFi’s fastest growing segment reached $303 million in revenue, driven by strong adoption of SoFi Money, rapid expansion of the Loan Platform Business, and innovations in SoFi Invest including improved user experience and an expanded partnership with Templum, unlocking access to a broader range of investment opportunities.
- Expanded the Loan Platform Business with over $8 billion in new commitments. With strong demand for SoFi’s personal loans, the company has finalized deals with Blue Owl, Fortress, and Edge Focus so far in 2025, and originated $1.6 billion in loans on behalf of third parties in Q1 alone.
- Accelerated loan originations and continued to expand products. Including the Loan Platform Business, SoFi originated a record $7.2 billion in loans in the quarter. With stronger technology and fulfillment capabilities and a new home equity offering launched within the past year, SoFi grew home loan originations by 54% from the first quarter of 2024. A planned personal loan product for prime credit card customers with revolving balances and a new SmartStart student loan refinancing product will give members more ways to get their money right.
- Further improved credit performance. SoFi’s annualized charge-off rate decreased from 3.37% to 3.31% for personal loans and from 62 basis points to 47 basis points for student loans compared to the fourth quarter of 2024. The on-balance sheet 90-day delinquency rate for personal loans decreased for the fourth consecutive quarter.
- Strengthened brand awareness to attract more members to SoFi’s ecosystem. With continued investment to build SoFi into a trusted household name, strong unaided brand awareness continued through the quarter at 7%. The company completed the inaugural season of TGL presented by SoFi, a new tech-driven stadium golf league that attracted over 20 million total viewers, and announced a new partnership with the Country Music Association’s CMA Fest.
- Launched new, fee-based subscription option for SoFi Plus. Nearly 90% of new SoFi Plus subscribers were existing members, demonstrating the value of making this product more accessible. Of these members, nearly 30% adopt an additional product within 30 days of enrollment. Among SoFi Plus subscribers who are completely new to SoFi, over 75% adopt at least a second product, and over 40% adopt a third product within 30 days of enrollment.
Consolidated Results
SoFi reported a number of key financial achievements. For the first quarter of 2025, GAAP net revenue of $771.8 million increased 20% relative to the prior-year period's $645.0 million. Record adjusted net revenue of $770.7 million grew 33% from the corresponding prior-year period of $580.6 million.
For the first quarter of 2025, total fee-based revenue reached a record of $315.4 million, a year-over-year increase of 67%. This was driven by strong performance from our Loan Platform Business, as well as origination fee revenue, referral fee revenue, interchange fee revenue and brokerage fee revenue. Together, the Financial Services and Technology Platform segments generated $406.5 million of net revenue, an increase of 66% from the prior year period.
SoFi reported its sixth consecutive quarter of GAAP profitability. For the first quarter of 2025, GAAP net income reached $71.1 million and diluted earnings per share reached $0.06.
First quarter record adjusted EBITDA of $210.3 million increased 46% from the prior year period's $144.4 million. This represents an adjusted EBITDA margin of 27%. All three segments delivered strong contribution profit, at attractive margins.
Equity grew by $153.4 million during the quarter, ending at $6.7 billion and $6.05 of book value per share. Tangible book value grew by $167.1 million during the quarter, ending the period at $5.1 billion. Tangible book value per share was $4.58 at quarter-end, up from $3.90 per share in the prior year period.
Net interest income of $498.7 million for the first quarter was up 24% year-over-year. This was driven by a 23% increase in average interest-earning assets and a 82 basis points decrease in cost of funds, partially offset by a 55 basis points decrease in average asset yields year-over-year.
For the first quarter, net interest margin of 6.01% increased 10 basis points sequentially from 5.91%, primarily due to lower cost of funds. The average rate on deposits was 189 basis points lower than that of warehouse facilities, which translates to approximately $515 million of annual interest expense savings.
Member and Product Growth
Continued growth in both total members and products in the first quarter is the result of our continued investments in innovation and brand building and reflects the benefits of our broad product suite and unique Financial Services Productivity Loop (FSPL) strategy.
Added a record 800,000 members in the first quarter of 2025, bringing total members over 10.9 million, up 34% from 8.1 million at the same prior year period.
Record product additions of 1.2 million in the first quarter of 2025, bringing total products to over 15.9 million, up 35% from 11.8 million at the same prior year period.
Financial Services products increased by 36% year-over-year to 13.8 million, primarily driven by continued demand for our SoFi Money, Relay and Invest products, and drove 90% of our total product growth. SoFi Money and SoFi Relay grew to 5.5 million and 5.1 million products, respectively, both representing 41% year-over-year growth. One third of Relay-first members that adopt a second product go on to adopt at least one more product.
Lending products increased by 25% year-over-year to 2.1 million products, driven primarily by continued demand for personal, student and home loan products.
Technology Platform enabled accounts increased by 5% year-over-year to 158 million.
Financial Services Segment Results
For the first quarter of 2025, Financial Services segment net revenue of $303.1 million more than doubled from the prior year period. Net interest income of $173.2 million increased 45% year-over-year, primarily driven by growth in consumer deposits. Noninterest income of $129.9 million more than quadrupled year-over-year, and now represents nearly $520 million in annualized revenue.
In the first quarter, SoFi's Loan Platform Business added $96.1 million to our consolidated adjusted net revenue. Of this $92.8 million was driven by $1.6 billion of personal loans originated on behalf of third parties as well as referrals to third parties. Additionally, our Loan Platform Business generated $3.3 million in servicing cash flow which is recorded in our Lending segment.
In addition to our Loan Platform Business, SoFi continued to see healthy growth in interchange fee revenue in the first quarter, up 90% year-over-year, respectively, as a result of nearly $16 billion in total annualized spend in the quarter across Money and Credit Card.
Contribution profit for the first quarter of 2025 reached $148.3 million, a $111.2 million improvement from the prior year period, while contribution margin grew 24 percentage points year-over-year to 49%. This is a reflection of the strong operating leverage generated in the segment, with directly attributable expenses increasing only 40%.
Financial Services – Segment Results of Operations |
|||||||||||
|
|
Three Months Ended March 31, |
|
|
|||||||
($ in thousands) |
|
|
2025 |
|
|
|
2024 |
|
|
% Change |
|
Net interest income |
|
$ |
173,199 |
|
|
$ |
119,713 |
|
|
45 |
% |
Noninterest income |
|
|
129,920 |
|
|
|
30,838 |
|
|
321 |
% |
Total net revenue – Financial Services |
|
|
303,119 |
|
|
|
150,551 |
|
|
101 |
% |
Provision for credit losses |
|
|
(5,639 |
) |
|
|
(7,165 |
) |
|
(21 |
)% |
Directly attributable expenses |
|
|
(149,148 |
) |
|
|
(106,212 |
) |
|
40 |
% |
Contribution profit – Financial Services |
|
$ |
148,332 |
|
|
$ |
37,174 |
|
|
299 |
% |
Contribution margin – Financial Services(1) |
|
|
49 |
% |
|
|
25 |
% |
|
|
|
(1) |
|
Contribution margin is defined for each of our reportable segments as contribution profit divided by net revenue. |
By continuously innovating with new and relevant offerings, features and rewards for members, SoFi grew total Financial Services products by 3.7 million, or 36%, year-over-year, bringing the total to 13.8 million at quarter-end. SoFi Money reached 5.5 million products, Relay reached 5.1 million products and SoFi Invest reached 2.7 million products by the end of the first quarter.
Monetization continues to improve with annualized revenue per product of $88 during the first quarter, up 48% year-over-year.
In the first quarter of 2025, total deposits grew to $27.3 billion, with over 90% of SoFi Money deposits (inclusive of Checking and Savings and cash management accounts) coming from direct deposit members.
Financial Services – Products |
|
March 31, |
|
|
|||||
|
|
2025 |
|
2024 |
|
% Change |
|||
Money(1) |
|
5,477,472 |
|
3,880,021 |
|
41 |
% |
||
Invest |
|
2,684,658 |
|
|
2,224,705 |
|
|
21 |
% |
Credit Card |
|
306,106 |
|
|
254,617 |
|
|
20 |
% |
Referred loans(2) |
|
102,986 |
|
|
59,555 |
|
|
73 |
% |
Relay |
|
5,094,484 |
|
|
3,613,686 |
|
|
41 |
% |
At Work |
|
119,886 |
|
|
92,389 |
|
|
30 |
% |
Total financial services products |
|
13,785,592 |
|
|
10,124,973 |
|
|
36 |
% |
(1) |
|
Includes checking and savings accounts held at SoFi Bank, and cash management accounts. |
(2) |
|
Limited to loans wherein we provide third party fulfillment services as part of our Loan Platform Business. |
Technology Platform Segment Results
Technology Platform segment net revenue of $103.4 million for the first quarter of 2025 increased 10% year-over-year. Contribution profit of $30.9 million reflected contribution margin of 30%.
SoFi continues to diversify its Technology Platform client base beyond financial services companies. During the quarter, SoFi launched a first-of-its-kind co-branded debit card program with Wyndham Hotels & Resorts. The investment made in building this new capability will help the business win additional consumer-brand clients. SoFi also recently signed a deal with Mercantil Banco, which offers personal and business banking services in Panama and will use our Cyberbank Digital banking platform.
Technology Platform – Segment Results of Operations |
|||||||||||
|
|
Three Months Ended March 31, |
|
|
|||||||
($ in thousands) |
|
|
2025 |
|
|
|
2024 |
|
|
% Change |
|
Net interest income |
|
$ |
413 |
|
|
$ |
501 |
|
|
(18 |
)% |
Noninterest income |
|
|
103,014 |
|
|
|
93,865 |
|
|
10 |
% |
Total net revenue – Technology Platform |
|
|
103,427 |
|
|
|
94,366 |
|
|
10 |
% |
Directly attributable expenses |
|
|
(72,514 |
) |
|
|
(63,624 |
) |
|
14 |
% |
Contribution profit |
|
$ |
30,913 |
|
|
$ |
30,742 |
|
|
1 |
% |
Contribution margin – Technology Platform(1) |
|
|
30 |
% |
|
|
33 |
% |
|
|
|
(1) |
|
Contribution margin is defined for each of our reportable segments as contribution profit divided by net revenue. |
Technology Platform total enabled client accounts increased 5% year-over-year, to 158.4 million up from 151.0 million in the prior-year period.
Technology Platform |
|
March 31, |
|
|
|||||
|
|
2025 |
|
2024 |
|
% Change |
|||
Total accounts |
|
158,432,347 |
|
151,049,375 |
|
5 |
% |
||
Lending Segment Results
For the first quarter of 2025, Lending segment GAAP net revenue of $413.4 million increased 25% from the prior year period, while adjusted net revenue for the segment of $412.3 million increased 27% from the prior year period.
Lending segment performance in the first quarter was driven by net interest income, which rose 35% year-over-year, primarily driven by growth in average loan balances of 22%.
Lending segment first quarter contribution profit of $238.9 million was up 15% from $207.7 million in the corresponding prior-year period. Lending segment adjusted contribution margin was strong at 58%. This strong margin reflects our ability to capitalize on continued strong demand for our lending products.
Lending – Segment Results of Operations |
|||||||||||
|
|
Three Months Ended March 31, |
|
|
|||||||
($ in thousands) |
|
|
2025 |
|
|
|
2024 |
|
|
% Change |
|
Net interest income |
|
$ |
360,621 |
|
|
$ |
266,536 |
|
|
35 |
% |
Noninterest income |
|
|
52,752 |
|
|
|
63,940 |
|
|
(17 |
)% |
Total net revenue – Lending |
|
|
413,373 |
|
|
|
330,476 |
|
|
25 |
% |
Servicing rights – change in valuation inputs or assumptions |
|
|
(1,074 |
) |
|
|
(5,226 |
) |
|
(79 |
)% |
Residual interests classified as debt – change in valuation inputs or assumptions |
|
|
35 |
|
|
|
73 |
|
|
(52 |
)% |
Directly attributable expenses |
|
|
(173,399 |
) |
|
|
(117,604 |
) |
|
47 |
% |
Contribution profit – Lending |
|
$ |
238,935 |
|
|
$ |
207,719 |
|
|
15 |
% |
Contribution margin – Lending(1) |
|
|
58 |
% |
|
|
63 |
% |
|
|
|
|
|
|
|
|
|
|
|||||
Adjusted net revenue – Lending (non-GAAP)(2) |
|
$ |
412,334 |
|
|
$ |
325,323 |
|
|
27 |
% |
Adjusted contribution margin – Lending (non-GAAP)(2) |
|
|
58 |
% |
|
|
64 |
% |
|
|
|
(1) |
|
Contribution margin is defined for each of our reportable segments as contribution profit divided by net revenue. |
(2) |
|
For more information and a reconciliation of these non-GAAP financial measures to the most comparable GAAP measure, see “Non-GAAP Financial Measures” and Table 2 to the “Financial Tables” herein. |
Lending – Loans At Fair Value |
||||||||||||||||
($ in thousands) |
Personal Loans |
|
Student Loans |
|
Home Loans |
|
Total |
|||||||||
March 31, 2025 |
|
|
|
|
|
|
|
|||||||||
Unpaid principal |
$ |
16,825,564 |
|
$ |
9,053,359 |
|
$ |
344,246 |
|
$ |
26,223,169 |
|||||
Accumulated interest |
|
126,203 |
|
|
|
49,501 |
|
|
|
1,069 |
|
|
|
176,773 |
|
|
Cumulative fair value adjustments(1) |
|
917,463 |
|
|
|
468,597 |
|
|
|
11,518 |
|
|
|
1,397,578 |
|
|
Total fair value of loans(2)(3) |
$ |
17,869,230 |
|
|
$ |
9,571,457 |
|
|
$ |
356,833 |
|
|
$ |
27,797,520 |
|
|
December 31, 2024 |
|
|
|
|
|
|
|
|||||||||
Unpaid principal |
$ |
16,589,623 |
|
|
$ |
8,215,629 |
|
|
$ |
149,862 |
|
|
$ |
24,955,114 |
|
|
Accumulated interest |
|
128,733 |
|
|
|
44,603 |
|
|
|
260 |
|
|
|
173,596 |
|
|
Cumulative fair value adjustments(1) |
|
814,040 |
|
|
|
337,136 |
|
|
|
2,374 |
|
|
|
1,153,550 |
|
|
Total fair value of loans(2)(3) |
$ |
17,532,396 |
|
|
$ |
8,597,368 |
|
|
$ |
152,496 |
|
|
$ |
26,282,260 |
|
|
(1) |
|
During the three months ended March 31, 2025, the cumulative fair value adjustments for personal loans were impacted by a higher unpaid principal balance, a lower weighted average discount rate and a lower weighted average annual default rate partially offset by a higher weighted average conditional prepayment rate and a lower weighted average coupon. The lower discount rate was driven by a 34 basis points decrease in benchmark rates and 8 basis points of spread tightening. The cumulative fair value adjustments for student loans were impacted by a higher unpaid principal balance, a lower weighted average discount rate, a higher weighted average coupon, a lower weighted average annual default rate and a lower weighted average conditional prepayment rate. The lower discount rate was driven by a 38 basis points decrease in benchmark rates partially offset by 20 basis points of spreads widening. |
(2) |
|
Each component of the fair value of loans is impacted by charge-offs during the period. Our fair value assumption for annual default rate incorporates fair value markdowns on loans beginning when they are 10 days or more delinquent, with additional markdowns at 30, 60 and 90 days past due. |
(3) |
|
Student loans are classified as loans held for investment, and personal loans and home loans are classified as loans held for sale. |
The following table summarizes the significant inputs to the fair value model for personal and student loans:
|
Personal Loans |
|
Student Loans |
|||||||||
|
March 31, 2025 |
|
December 31, 2024 |
|
March 31, 2025 |
|
December 31, 2024 |
|||||
Weighted average coupon rate(1) |
13.30 |
% |
|
13.44 |
% |
|
6.01 |
% |
|
5.91 |
% |
|
Weighted average annual default rate |
4.37 |
% |
|
4.55 |
% |
|
0.67 |
% |
|
0.73 |
% |
|
Weighted average conditional prepayment rate |
26.53 |
% |
|
26.01 |
% |
|
10.93 |
% |
|
10.95 |
% |
|
Weighted average discount rate |
4.87 |
% |
|
5.29 |
% |
|
4.22 |
% |
|
4.40 |
% |
|
Benchmark rate(2) |
3.74 |
% |
|
4.08 |
% |
|
3.66 |
% |
|
4.04 |
% |
|
(1) |
|
Represents the average coupon rate on loans held on balance sheet, weighted by unpaid principal balance outstanding at the balance sheet date. |
(2) |
|
Corresponds with two-year SOFR for personal loans, and four-year SOFR for student loans. |
For the first quarter of 2025, record origination volume of $7.2 billion increased 66% year-over-year. This was a result of continued strong member demand for personal loans, student loans and home loans as well as strong demand from capital markets partners.
Personal loan record originations of $5.5 billion in the first quarter of 2025 were up 69% year-over-year, inclusive of $1.6 billion originated on behalf of third parties for our Loan Platform Business. First quarter student loan volume of $1.2 billion was up 59% year-over-year. Home equity loan originations were a record during the first quarter, accounting for more than one-third of total home loan volume. In total, home loan volume was $518 million, an increase of 54% year-over-year.
Capital markets activity in the first quarter of 2025 was very strong. Overall, SoFi sold, or transferred through our Loan Platform Business, more than $3.1 billion in total of personal loans and home loans. In terms of personal loans, we closed $1.1 billion of sales in whole loan form at a blended execution of 106.2%. In terms of home loan sales, we closed $322 million at a blended execution of 102.1%.
In addition to our personal and home loan sales, SoFi executed a $698 million co-contributor securitization of loans previously originated through our Loan Platform Business. This was the first securitization of new collateral in our SoFi Consumer Loan Program (SCLP) since 2021 and the first using collateral originated in the Loan Platform Business. Importantly, this channel provides our partners with meaningful liquidity to support their ongoing investment in the Loan Platform Business. The transaction priced at industry-leading cost-of-funds levels, with a weighted average spread of 87 basis points and an all-in yield of 5.10%.
Credit performance further strengthened in the first quarter. The on-balance sheet 90 day delinquency rate for personal loans decreased from 55 basis points to 46 basis points, while the on-balance sheet 90 day delinquency rate for student loans was 13 basis points, in line with the prior quarter.
Personal loan annualized charge-off rate decreased to 3.31% from 3.37% in the prior quarter, including the impact of asset sales, new originations and the delinquency sales in the quarter. Had SoFi not sold these late stage delinquent loans, it is estimated that, including recoveries, they would have had an all-in annualized net charge-off rate for personal loans of approximately 4.8% vs. 4.9% in the prior quarter.
The data continues to support a 7–8% maximum life of loan loss assumption for personal loans, in line with SoFi's underwriting tolerance.
Recent vintages, originated from the fourth quarter of 2022 to the second quarter of 2024 have net cumulative losses of 4.09%, with 43% unpaid principal balance remaining. This is well below the 5.53% observed at the same point in time for the 2017 vintage which is the last vintage that approached our 7-8% tolerance. The gap between the newer cohort curve and the 2017 cohort curve improved by 16 basis points, after improving 15 basis points in the fourth quarter of 2024, demonstrating continued improvement.
Additionally, of the first quarter of 2020 through the fourth quarter of 2024 originations, 59% of principal has already been paid down, with 6.7% in net cumulative losses. Therefore, for life-of-loan losses on this entire cohort of loans to reach 8%, the charge-off rate on the remaining 41% of unpaid principal would need to be approximately 10%. This would be well above past levels, providing further confidence in achieving loss rates below our 8% tolerance.
Lending – Originations and Average Balances |
|||||||||||
|
|
Three Months Ended March 31, |
|
% Change |
|||||||
|
|
|
2025 |
|
|
|
2024 |
|
|
||
Origination volume ($ in thousands, during period) |
|
|
|
|
|
|
|||||
Personal loans(1) |
|
$ |
5,536,841 |
|
$ |
3,278,882 |
|
69 |
% |
||
Student loans |
|
|
1,191,463 |
|
|
|
751,680 |
|
|
59 |
% |
Home loans |
|
|
517,758 |
|
|
|
336,148 |
|
|
54 |
% |
Total |
|
$ |
7,246,062 |
|
|
$ |
4,366,710 |
|
|
66 |
% |
Average loan balance ($, as of period end)(2) |
|
|
|
|
|
|
|||||
Personal loans |
|
$ |
25,598 |
|
|
$ |
24,259 |
|
|
6 |
% |
Student loans |
|
|
43,103 |
|
|
|
44,448 |
|
|
(3 |
)% |
Home loans |
|
|
268,674 |
|
|
|
282,917 |
|
|
(5 |
)% |
(1) |
|
Inclusive of origination volume related to our Loan Platform Business. |
(2) |
|
Within each loan product category, average loan balance is defined as the total unpaid principal balance of the loans divided by the number of loans that have a balance greater than zero dollars as of the reporting date. Average loan balance includes loans on our balance sheet, as well as transferred loans and referred loans with which SoFi has continuing involvement through our servicing agreements. |
Lending – Products |
|
March 31, |
|
|
|||||
|
|
2025 |
|
2024 |
|
% Change |
|||
Personal loans(1) |
|
1,507,344 |
|
1,152,688 |
|
31 |
% |
||
Student loans |
|
583,914 |
|
|
521,835 |
|
|
12 |
% |
Home loans |
|
38,575 |
|
|
30,632 |
|
|
26 |
% |
Total lending products |
|
2,129,833 |
|
|
1,705,155 |
|
|
25 |
% |
(1) |
|
Includes loans which we originate as part of our Loan Platform Business. |
Guidance and Outlook
Given the strong start to the year, management is increasing its 2025 guidance.
For the full year 2025, management now expects to deliver adjusted net revenue of $3.235 to $3.310 billion, which is $35 million higher than the prior guidance range of $3.200 to $3.275 billion. This implies 24% to 27% annual growth versus 23% to 26% in our prior guidance. Management expects adjusted EBITDA of $875 to $895 million, above prior guidance of $845 to $865 million. This represents an incremental EBITDA margin of 27%, consistent with our long term investment philosophy.
Contacts
Investors:
SoFi Investor Relations
IR@sofi.com
Media:
SoFi Media Relations
PR@sofi.com
Read full story here


