Revenue of $1.28 billion in the fourth quarter, representing 30% year-over-year growth
Financial Highlights:
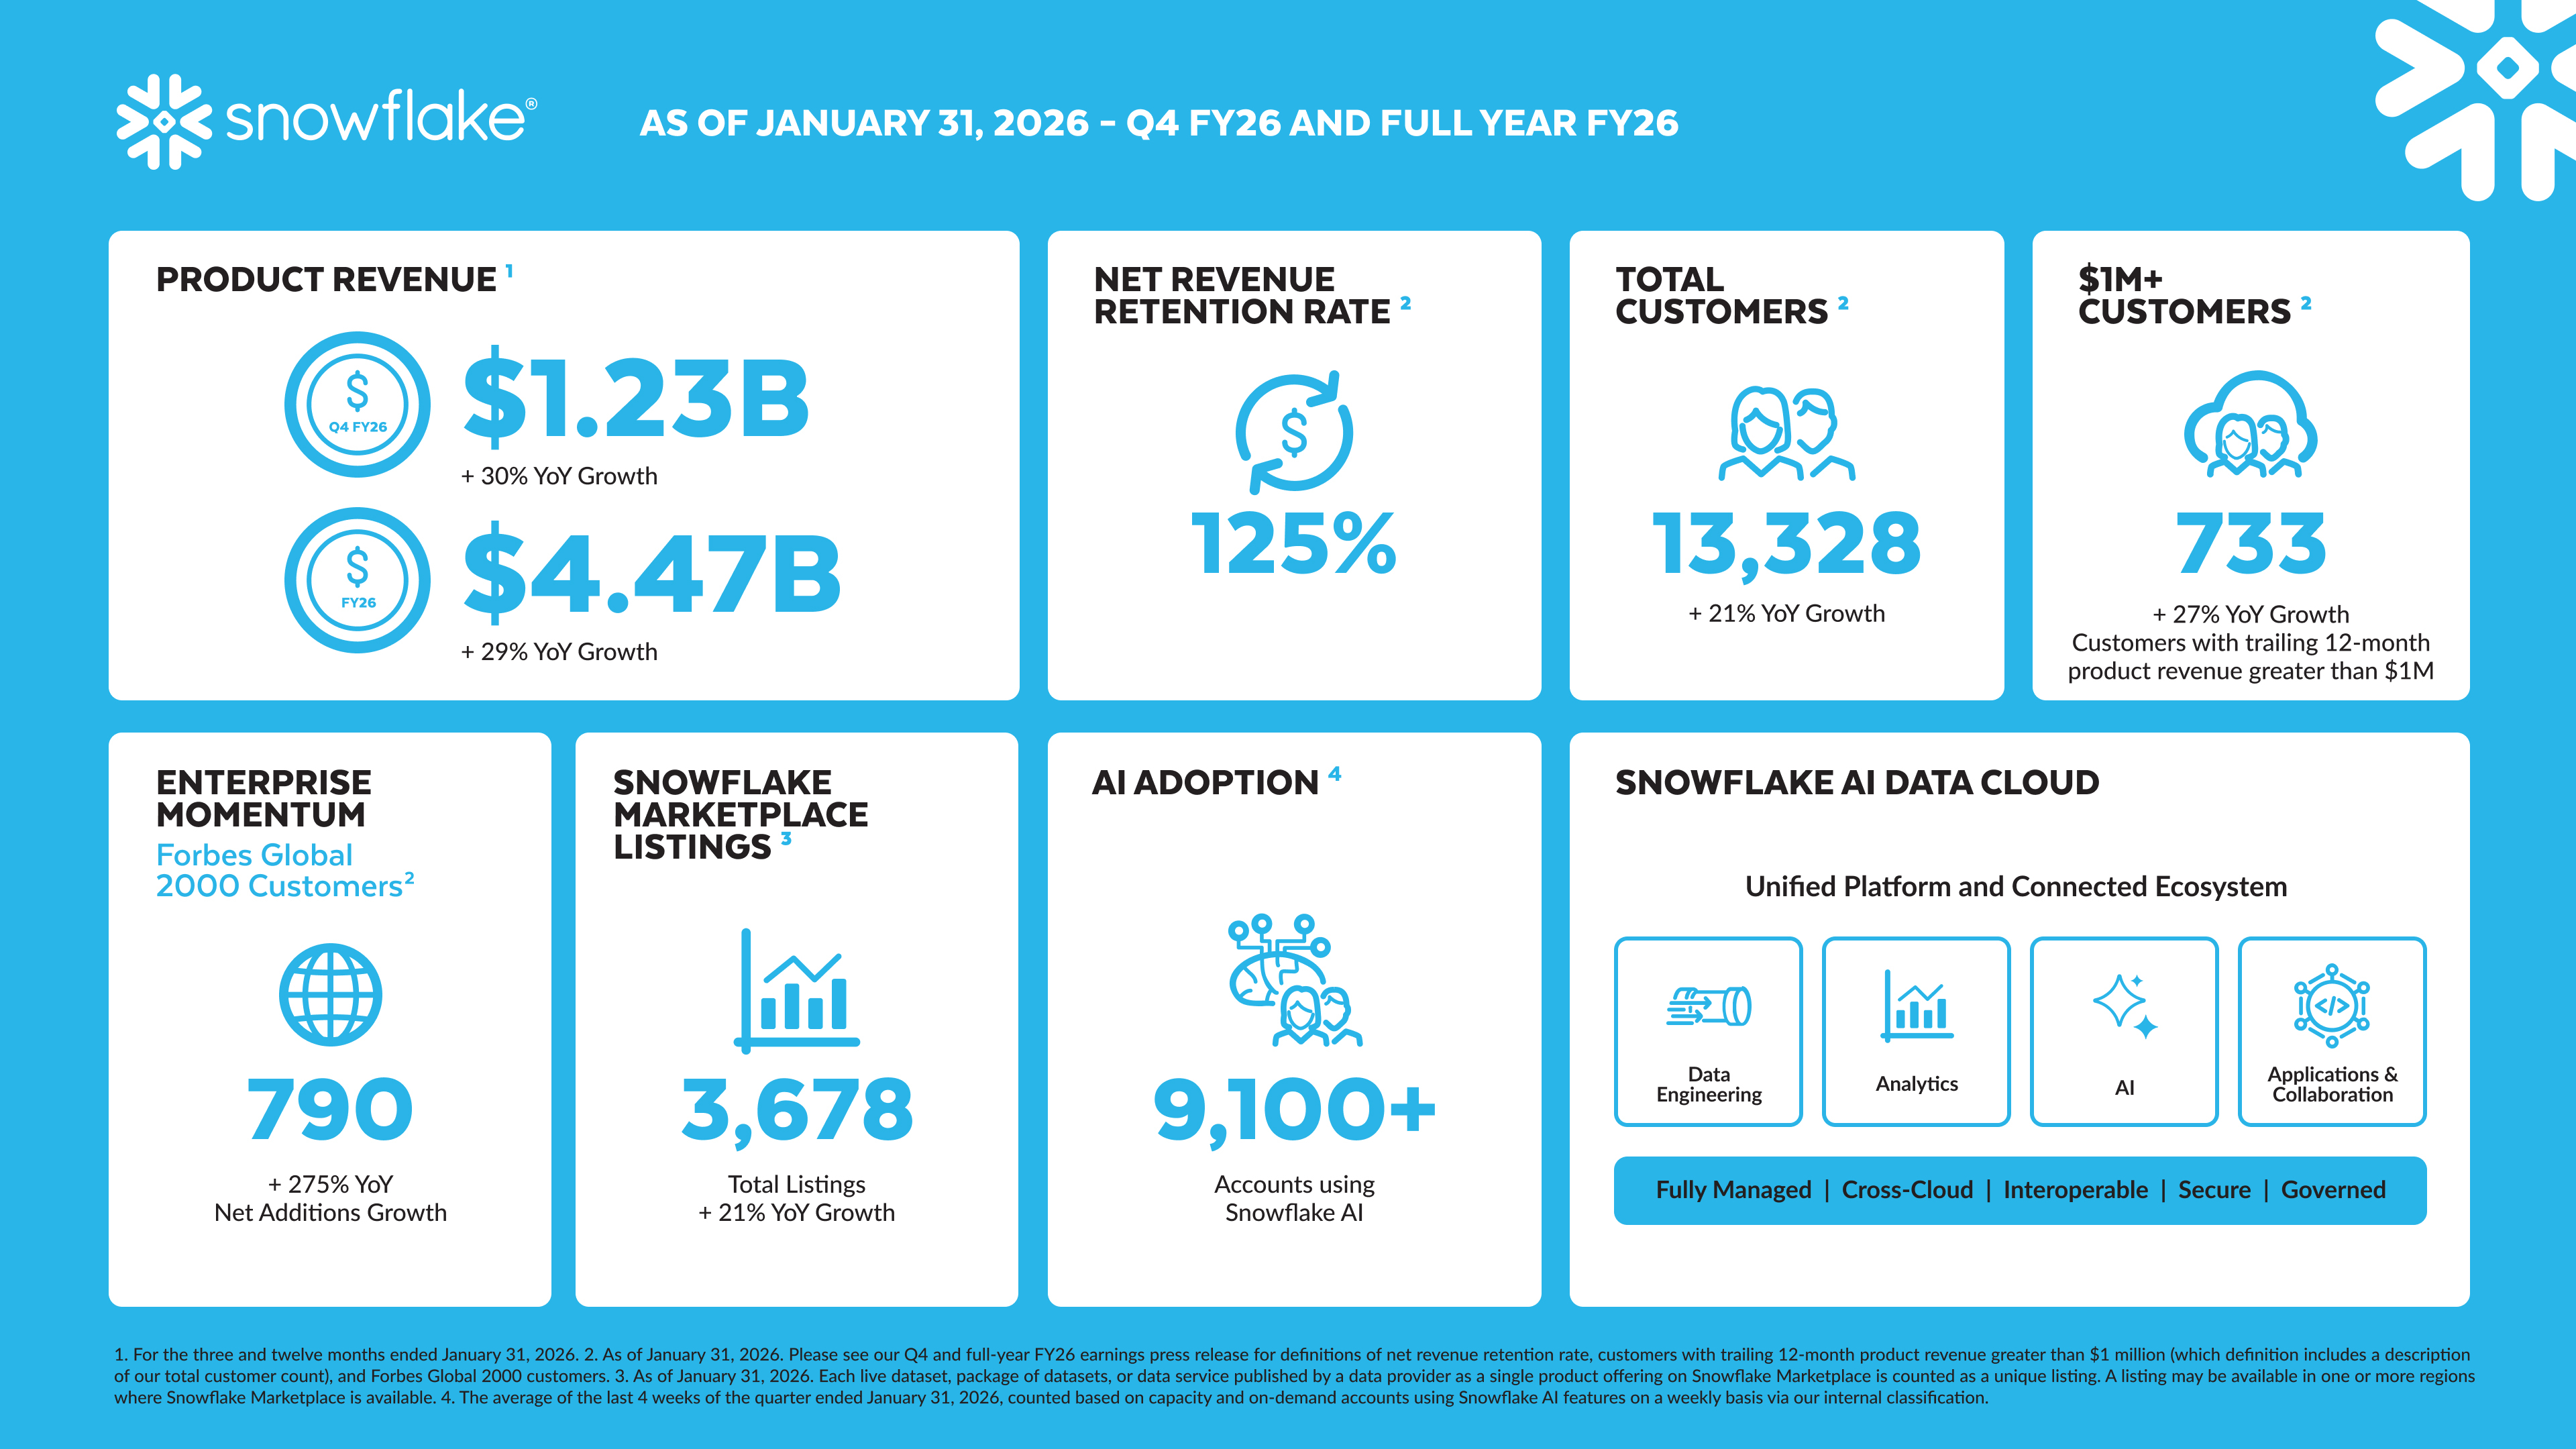

- Product revenue of $1.23 billion in the fourth quarter, representing 30% year-over-year growth
- Net revenue retention rate of 125%
- 733 customers with trailing 12-month product revenue greater than $1 million, representing 27% year-over-year growth
- 740 net new customer additions, representing 40% year-over-year growth
- Remaining performance obligations of $9.77 billion, representing 42% year-over-year growth
MENLO PARK, Calif.--(BUSINESS WIRE)--$SNOW #TheAIDataCloud--Snowflake (NYSE: SNOW), the AI Data Cloud company, today announced financial results for its fourth quarter and full-year of fiscal 2026, ended January 31, 2026.
“Snowflake delivered another strong quarter with product revenue of $1.23 billion, up 30% year-over-year, and remaining performance obligations totaling $9.77 billion, up 42% year-over-year,” said Sridhar Ramaswamy, CEO of Snowflake. “This past year has been transformative for every business, as the promise of AI became real, and Snowflake sits at the center of the enterprise AI revolution. For over a decade, we’ve built the foundation that makes AI safe and scalable — a single source of truth, cross-cloud interoperability, and enterprise-grade governance. Now, we’re activating world-class agentic capabilities on top of that platform. With rapid innovation, tight go-to-market alignment, and disciplined execution, we’re well positioned to lead this next phase.”
“This quarter reflects the strength of our strategy focused on two fundamentals for durable growth: landing new customers and expanding them into strategic, long-term relationships,” said Brian Robins, CFO of Snowflake. “We delivered strong new logo momentum, adding 740 net new customers, up 40% year-over-year, while continuing to deepen engagement across our base. We now have 733 customers spending more than $1 million on a trailing 12-month basis, and a record number exceeding $10 million. As we look ahead, our focus remains on driving stability and operational rigor to support sustained, long-term growth.”
Snowflake Business Highlights:
- AI Momentum: With over 9,1001 accounts using Snowflake AI features, including Toyota Motor Europe and United Rentals, Snowflake’s leading AI capabilities have become the cornerstone for customers' AI strategies. Snowflake Intelligence has gone from a nascent offering to an essential capability for almost 2,5001 accounts in 3 months. AI is driving expanded workloads and a broader user base, reinforcing the strength of Snowflake’s overall business.
- Customer Growth and Expansion: Strongest ever quarter for net new customer acquisition, with 740 net new customers this quarter, and a record number of customers surpassing $10 million in trailing 12-month spend. As of January 31, 2026, Snowflake served 790 of the Forbes Global 2000 customers, representing 5% year-over-year growth, underscoring deepening enterprise adoption. Customers like Capital One and Thomson Reuters are using Snowflake to advance their data and analytics foundations.
- Accelerated Product Velocity: Introduced 430+ new capabilities in fiscal 2026, reflecting sustained innovation across the AI Data Cloud. Our latest innovations include Cortex Code, a cutting-edge AI coding agent, as well as extending Cortex Code CLI to now encompass data systems.
- Expanded Partnerships: With Anthropic, Google Cloud, and OpenAI, Snowflake continues to expand native access to leading foundation models, enhancing secure model choice and platform flexibility for customers.
- Acquisitions: Observe by Snowflake brings the company into the $50+ billion IT operations market, integrating observability into data and AI workloads to improve reliability and reduce operational complexity. Snowflake also acquired TensorStax to strengthen AI-driven data engineering within Cortex Code.
See the section titled “Key Business Metrics” for definitions of product revenue, net revenue retention rate, customers with trailing 12-month product revenue greater than $1 million, Forbes Global 2000 customers, and remaining performance obligations.
____________________ |
1 The average of the last 4 weeks of the quarter ended January 31, 2026, counted based on capacity and on-demand accounts using the respective features on a weekly basis via our internal classification. |
Financial Outlook:
Our guidance includes GAAP and non-GAAP financial measures.
The following table summarizes our guidance for the first quarter and full-year of fiscal 2027:
|
First Quarter Fiscal 2027
|
|
Full-Year Fiscal 2027
| |||||
|
Amount
|
Year/Year
|
|
Amount
|
Year/Year
| |||
Product revenue | $1,262 - $1,267 | 27% |
| $5,660 | 27% | |||
|
|
|
|
|
| |||
|
| Margin |
|
| Margin | |||
Non-GAAP product gross profit(1) |
|
|
|
| 75.0% | |||
Non-GAAP operating income(1) |
| 9.0% |
|
| 12.5% | |||
Non-GAAP adjusted free cash flow(1) |
|
|
|
| 23.0% | |||
|
|
|
|
|
| |||
|
Amount
|
|
|
Amount
|
| |||
Non-GAAP weighted-average shares used in computing net income per share attributable to Snowflake Inc. common stockholders—diluted(1)(2) | 374 |
|
| 376 |
| |||
|
|
|
|
|
| |||
(1) We report non-GAAP financial measures in addition to, and not as a substitute for, or superior to, financial measures calculated in accordance with GAAP. See the section titled “Statement Regarding Use of Non-GAAP Financial Measures” for an explanation of non-GAAP financial measures.
(2) The potential impact of future repurchases under our stock repurchase program is not reflected in our guidance for weighted-average shares used in computing net income per share attributable to Snowflake Inc. common stockholders—diluted due to the uncertainty regarding, and the potential variability of, the timing and amount of repurchases. Additionally, the dilutive effect of the shares issuable upon conversion of our 0% convertible senior notes due 2027 and 0% convertible senior notes due 2029 (the Notes) using the if-converted method, estimated at approximately 12 million shares for the first quarter and full-year of fiscal 2027 based on the current conversion price and net of the potential antidilutive impact of the capped call transactions entered into in connection with the Notes (the Capped Calls), is reflected in our guidance for weighted-average shares used in computing net income per share attributable to Snowflake Inc. common stockholders—diluted. Upon conversion of the Notes, we may choose to satisfy our conversion obligations by paying or delivering, as the case may be, cash, shares of our common stock, or a combination of both. The Capped Calls will have an antidilutive impact when the average stock price of our common stock in a given period is higher than their exercise price. The estimated antidilutive impact of the Capped Calls reflected in our guidance is based on the market price of our common stock as of January 31, 2026, and is subject to change with future stock price movements. | ||||||||
Fourth Quarter Fiscal 2026 GAAP and Non-GAAP Results:
The following table summarizes our financial results for the fourth quarter of fiscal 2026:
|
Fourth Quarter Fiscal 2026
|
|
Fourth Quarter Fiscal 2026
| |||||
|
Amount
|
Year/Year
|
|
|
| |||
Product revenue | $1,226.6 | 30% |
|
|
| |||
|
|
|
|
|
| |||
|
Amount
| Margin |
|
Amount
| Margin | |||
Product gross profit | $874.7 | 71% |
| $921.5 | 75% | |||
Operating income (loss) | ($318.2) | (25%) |
| $139.2 | 11% | |||
Net cash provided by operating activities | $781.2 | 61% | (2) |
|
| |||
Free cash flow |
|
|
| $765.1 | 60% | |||
Adjusted free cash flow |
|
|
| $782.2 | 61% | |||
|
|
|
|
|
| |||
(1) We report non-GAAP financial measures in addition to, and not as a substitute for, or superior to, financial measures calculated in accordance with GAAP. See the section titled “Statement Regarding Use of Non-GAAP Financial Measures” for an explanation of non-GAAP financial measures, and the table titled “GAAP to Non-GAAP Reconciliations” for a reconciliation of GAAP to non-GAAP financial measures.
(2) Calculated as net cash provided by operating activities as a percentage of revenue.
Note: Fiscal year ends January 31. Numbers are rounded for presentation purposes. | ||||||||
Full-Year Fiscal 2026 GAAP and Non-GAAP Results:
The following table summarizes our financial results for the full-year of fiscal 2026:
|
Full-Year Fiscal 2026
|
|
Full-Year Fiscal 2026
| |||||
|
Amount
|
Year/Year
|
|
|
| |||
Product revenue | $4,472.3 | 29% |
|
|
| |||
|
|
|
|
|
| |||
|
Amount
| Margin |
|
Amount
| Margin | |||
Product gross profit | $3,212.0 | 72% |
| $3,388.4 | 76% | |||
Operating income (loss) | ($1,435.2) | (31%) |
| $489.7 | 10% | |||
Net cash provided by operating activities | $1,221.9 | 26% | (2) |
|
| |||
Free cash flow |
|
|
| $1,120.3 | 24% | |||
Adjusted free cash flow |
|
|
| $1,192.7 | 25% | |||
|
|
|
|
|
| |||
(1) We report non-GAAP financial measures in addition to, and not as a substitute for, or superior to, financial measures calculated in accordance with GAAP. See the section titled “Statement Regarding Use of Non-GAAP Financial Measures” for an explanation of non-GAAP financial measures, and the table titled “GAAP to Non-GAAP Reconciliations” for a reconciliation of GAAP to non-GAAP financial measures.
(2) Calculated as net cash provided by operating activities as a percentage of revenue.
Note: Fiscal year ends January 31. Numbers are rounded for presentation purposes. | ||||||||
A reconciliation of GAAP guidance measures to corresponding non-GAAP guidance measures is not available on a forward-looking basis without unreasonable effort due to the uncertainty regarding, and the potential variability of, expenses that may be incurred in the future. Stock-based compensation-related charges, including employer payroll tax-related items on employee stock transactions, are impacted by the timing of employee stock transactions, the future fair market value of our common stock, and our future hiring and retention needs, all of which are difficult to predict and subject to constant change. These factors could be material to our results computed in accordance with GAAP. We have provided a reconciliation of GAAP to non-GAAP financial measures in the financial statement tables for our historical non-GAAP financial results included in this release. Our fiscal year ends January 31, and numbers are rounded for presentation purposes.
Conference Call Details
The conference call will begin at 2 p.m. Pacific Time on February 25, 2026. Investors and participants may attend the call by dialing (833) 470-1428 (Access code: 084430). For investors and participants outside the United States, see global dial-in numbers at https://www.netroadshow.com/events/global-numbers?confId=90709 (Access code: 084430).
The call will also be webcast live on the Snowflake Investor Relations website at https://investors.snowflake.com.
An audio replay of the conference call and webcast will be available two hours after its completion and will be accessible for 30 days on the Snowflake Investor Relations website.
Investor Presentation Details
An investor presentation providing additional information and analysis can be found at https://investors.snowflake.com.
Statement Regarding Use of Non‑GAAP Financial Measures
We report the following non-GAAP financial measures, which have not been prepared in accordance with generally accepted accounting principles in the United States (GAAP), in addition to, and not as a substitute for, or superior to, financial measures calculated in accordance with GAAP.
- Non-GAAP Product gross profit, Operating income, Net income, Net income attributable to Snowflake Inc., and Net income per share attributable to Snowflake Inc. common stockholders—basic and diluted. Non-GAAP product gross profit, operating income, net income, and net income attributable to Snowflake Inc. are each defined as the respective GAAP measure, excluding, as applicable, the effect of (i) stock-based compensation-related charges, including employer payroll tax-related items on employee stock transactions, (ii) amortization of acquired intangibles, (iii) expenses associated with acquisitions and strategic investments, (iv) amortization of debt issuance costs, (v) restructuring charges, net of associated income and recoveries, (vi) asset impairment related to office facility exit, net of associated sublease income, if any, (vii) adjustments attributable to noncontrolling interest, and (viii) the related income tax effect of these adjustments as well as the non-recurring income tax expense or benefit associated with acquisitions. Non-GAAP product gross margin is calculated as non-GAAP product gross profit as a percentage of product revenue. Non-GAAP operating margin is calculated as non-GAAP operating income as a percentage of revenue. Our non-GAAP net income per share attributable to Snowflake Inc. common stockholders—basic is calculated by dividing non-GAAP net income attributable to Snowflake Inc. by the weighted-average number of shares of common stock outstanding during the period. Our non-GAAP net income per share attributable to Snowflake Inc. common stockholders—diluted is calculated by dividing non-GAAP net income attributable to Snowflake Inc. by the non-GAAP weighted-average number of diluted shares outstanding, which includes (a) the effect of all potentially dilutive common stock equivalents (stock options, restricted stock units, employee stock purchase rights under our 2020 Employee Stock Purchase Plan), (b) the potential dilutive effect of the shares issuable upon conversion of the Notes using the if-converted method, and (c) the antidilutive impact, if any, of the Capped Calls entered into in connection with the Notes. The Capped Calls are expected to reduce the potential dilution to our common stock upon any conversion of the Notes under certain circumstances. Under GAAP, the antidilutive impact of the Capped Calls is not reflected in diluted shares outstanding until exercised. The potential dilutive effect of outstanding restricted stock units with performance conditions not yet satisfied is included in the non-GAAP weighted-average number of diluted shares at forecasted attainment levels to the extent we believe it is probable that the performance conditions will be met. Amounts attributable to noncontrolling interest were not material for all periods presented. We believe the presentation of operating results that exclude these items that are (i) non-cash items, (ii) non-recurring items, or (iii) items that have highly variable amounts due to factors beyond our control and are unrelated to our core operations such that management does not consider them in evaluating the business performance or making operating plans, provides useful supplemental information to investors and facilitates the analysis of our operating results and comparison of operating results across reporting periods.
- Free cash flow. Free cash flow is defined as net cash provided by operating activities reduced by purchases of property and equipment and capitalized software development costs. Cash outflows for employee payroll tax items related to the net share settlement of equity awards are included in cash flow for financing activities and, as a result, do not have an effect on the calculation of free cash flow. Free cash flow margin is calculated as free cash flow as a percentage of revenue. We believe these measures provide useful supplemental information to investors because they are indicators of the strength and performance of our core business operations.
- Adjusted free cash flow. Adjusted free cash flow is defined as free cash flow plus (minus) net cash paid (received) on employer and employee payroll tax-related items on employee stock transactions. Employee payroll tax-related items on employee stock transactions are generally pass-through transactions that are expected to have a net zero impact on free cash flow over time, but that may impact free cash flow in any given fiscal quarter due to differences between the time that we receive funds from our employees and the time we remit those funds to applicable tax authorities. We believe that excluding the effects of these payroll tax-related items will enhance stockholders' ability to evaluate our free cash flow performance, including on a quarter-over-quarter basis. Adjusted free cash flow margin is calculated as adjusted free cash flow as a percentage of revenue. We believe these measures provide useful supplemental information to investors because they are indicators of the strength and performance of our core business operations.
We use these non-GAAP financial measures internally for financial and operational decision-making purposes and as a means to evaluate period-to-period comparisons. Non-GAAP financial measures are not meant to be considered in isolation or as a substitute for comparable GAAP financial measures and should be read only in conjunction with our condensed consolidated financial statements prepared in accordance with GAAP. Our presentation of non-GAAP financial measures may not be comparable to similar measures used by other companies. We encourage investors to carefully consider our results under GAAP, as well as our supplemental non-GAAP information and the reconciliation between these presentations, to more fully understand our business. Please see the tables included at the end of this release for the reconciliation of GAAP to non-GAAP results.
Key Business Metrics
We monitor our key business metrics, including (i) free cash flow and (ii) the other metrics set forth below to help us evaluate our business and growth trends, establish budgets, measure the effectiveness of our sales and marketing efforts, and assess operational efficiencies. See the section titled “Statement Regarding Use of Non-GAAP Financial Measures” for the definition of free cash flow. The calculation of our key business metrics may differ from other similarly titled metrics used by other companies, securities analysts, or investors.
- Product Revenue. Product revenue is a key metric for us because we recognize revenue based on platform consumption, which is inherently variable at our customers’ discretion, and not based on the amount and duration of contract terms. Product revenue is primarily derived from the consumption of compute, storage, and data transfer resources by customers on our platform. Customers have the flexibility to consume more than their contracted capacity during the contract term and may have the ability to roll over unused capacity to future periods, generally upon the purchase of additional capacity at renewal. Our consumption-based business model distinguishes us from subscription-based software companies that generally recognize revenue ratably over the contract term and may not permit rollover. Because customers have flexibility in the timing of their consumption, which can exceed their contracted capacity or extend beyond the original contract term in many cases, the amount of product revenue recognized in a given period is an important indicator of customer satisfaction and the value derived from our platform. While customer use of our platform in any period is not necessarily indicative of future use, we estimate future revenue using predictive models based on customers’ historical usage to plan and determine financial forecasts. Product revenue excludes our professional services and other revenue.
- Net Revenue Retention Rate. To calculate net revenue retention rate, we first specify a measurement period consisting of the trailing two years from our current period end. Next, we define as our measurement cohort the population of customers under capacity contracts that used our platform at any point in the first month of the first year of the measurement period. The cohorts used to calculate net revenue retention rate include end-customers under a reseller arrangement. We then calculate our net revenue retention rate as the quotient obtained by dividing our product revenue from this cohort in the second year of the measurement period by our product revenue from this cohort in the first year of the measurement period. Any customer in the cohort that did not use our platform in the second year remains in the calculation and contributes zero product revenue in the second year. Our net revenue retention rate is subject to adjustments for acquisitions, consolidations, spin-offs, and other market activity, and we present our net revenue retention rate for historical periods reflecting these adjustments. Since we will continue to attribute the historical product revenue to the consolidated contract, consolidation of capacity contracts within a customer’s organization typically will not impact our net revenue retention rate unless one of those customers was not a customer at any point in the first month of the first year of the measurement period.
- Customers with Trailing 12-Month Product Revenue Greater than $1 Million. To calculate the number of customers with trailing 12-month product revenue greater than $1 million, we count the number of customers under capacity arrangements that contributed more than $1 million in product revenue in the trailing 12 months. For purposes of determining our customer count, we treat each customer account, including accounts for end-customers under a reseller arrangement, that has at least one corresponding capacity contract as a unique customer, and a single organization with multiple divisions, segments, or subsidiaries may be counted as multiple customers. We do not include customers that consume our platform only under on-demand arrangements for purposes of determining our customer count. Our customer count is subject to adjustments for acquisitions, consolidations, spin-offs, and other market activity, and we present our customer count for historical periods reflecting these adjustments.
- Forbes Global 2000 Customers. Our Forbes Global 2000 customer count is a subset of our customer count based on the 2025 Forbes Global 2000 list. Our Forbes Global 2000 customer count is subject to adjustments for annual updates to the list by Forbes, as well as acquisitions, consolidations, spin-offs, and other market activity with respect to such customers, and we present our Forbes Global 2000 customer count for historical periods reflecting these adjustments.
- Remaining Performance Obligations. Remaining performance obligations (RPO) represent the amount of contracted future revenue that has not yet been recognized, including (i) deferred revenue and (ii) non-cancelable contracted amounts that will be invoiced and recognized as revenue in future periods. RPO excludes performance obligations from on-demand arrangements and certain time and materials contracts that are billed in arrears. Portions of RPO that are not yet invoiced and are denominated in foreign currencies are revalued into U.S. dollars each period based on the applicable period-end exchange rates. RPO is not necessarily indicative of future product revenue growth because it does not account for the timing of customers’ consumption or their consumption of more than their contracted capacity. Moreover, RPO is influenced by a number of factors, including the timing and size of renewals, the timing and size of purchases of additional capacity, average contract terms, seasonality, changes in foreign currency exchange rates, and the extent to which customers are permitted to roll over unused capacity to future periods, generally upon the purchase of additional capacity at renewal.
Contacts
Investor Contact
Katherine McCracken
IR@snowflake.com
Press Contact
Eszter Szikora
Press@snowflake.com
Read full story here