-
IMAX delivers above expectations for full year 2025 across key metrics:
- Best-ever Revenue of $410 million, up 16% year-over-year
- Strong operating profitability with Net Income margin of 11% and record Adjusted EBITDA(1) margin of 45%
- Record Cash from Operating Activities of $127 million, up 79% year-over-year
- Highest grossing year ever for IMAX at the global box office with $1.28 billion; IMAX local language box office of $405 million shatters previous full-year record by 66%
- 2025 system installations of 160 at very high-end of full year guidance (145 to 160); signings of 166 eclipse 2024 by 28%
- 2026 guidance points to another strong year including $1.4 billion in IMAX box office, 160 to 175 system installations and Adjusted EBITDA margin in the mid-40’s (above 45%)
NEW YORK--(BUSINESS WIRE)--IMAX Corporation (NYSE: IMAX) today reported excellent financial results for the fourth quarter and full-year of 2025, demonstrating the value of its unique global entertainment platform and broad content portfolio.
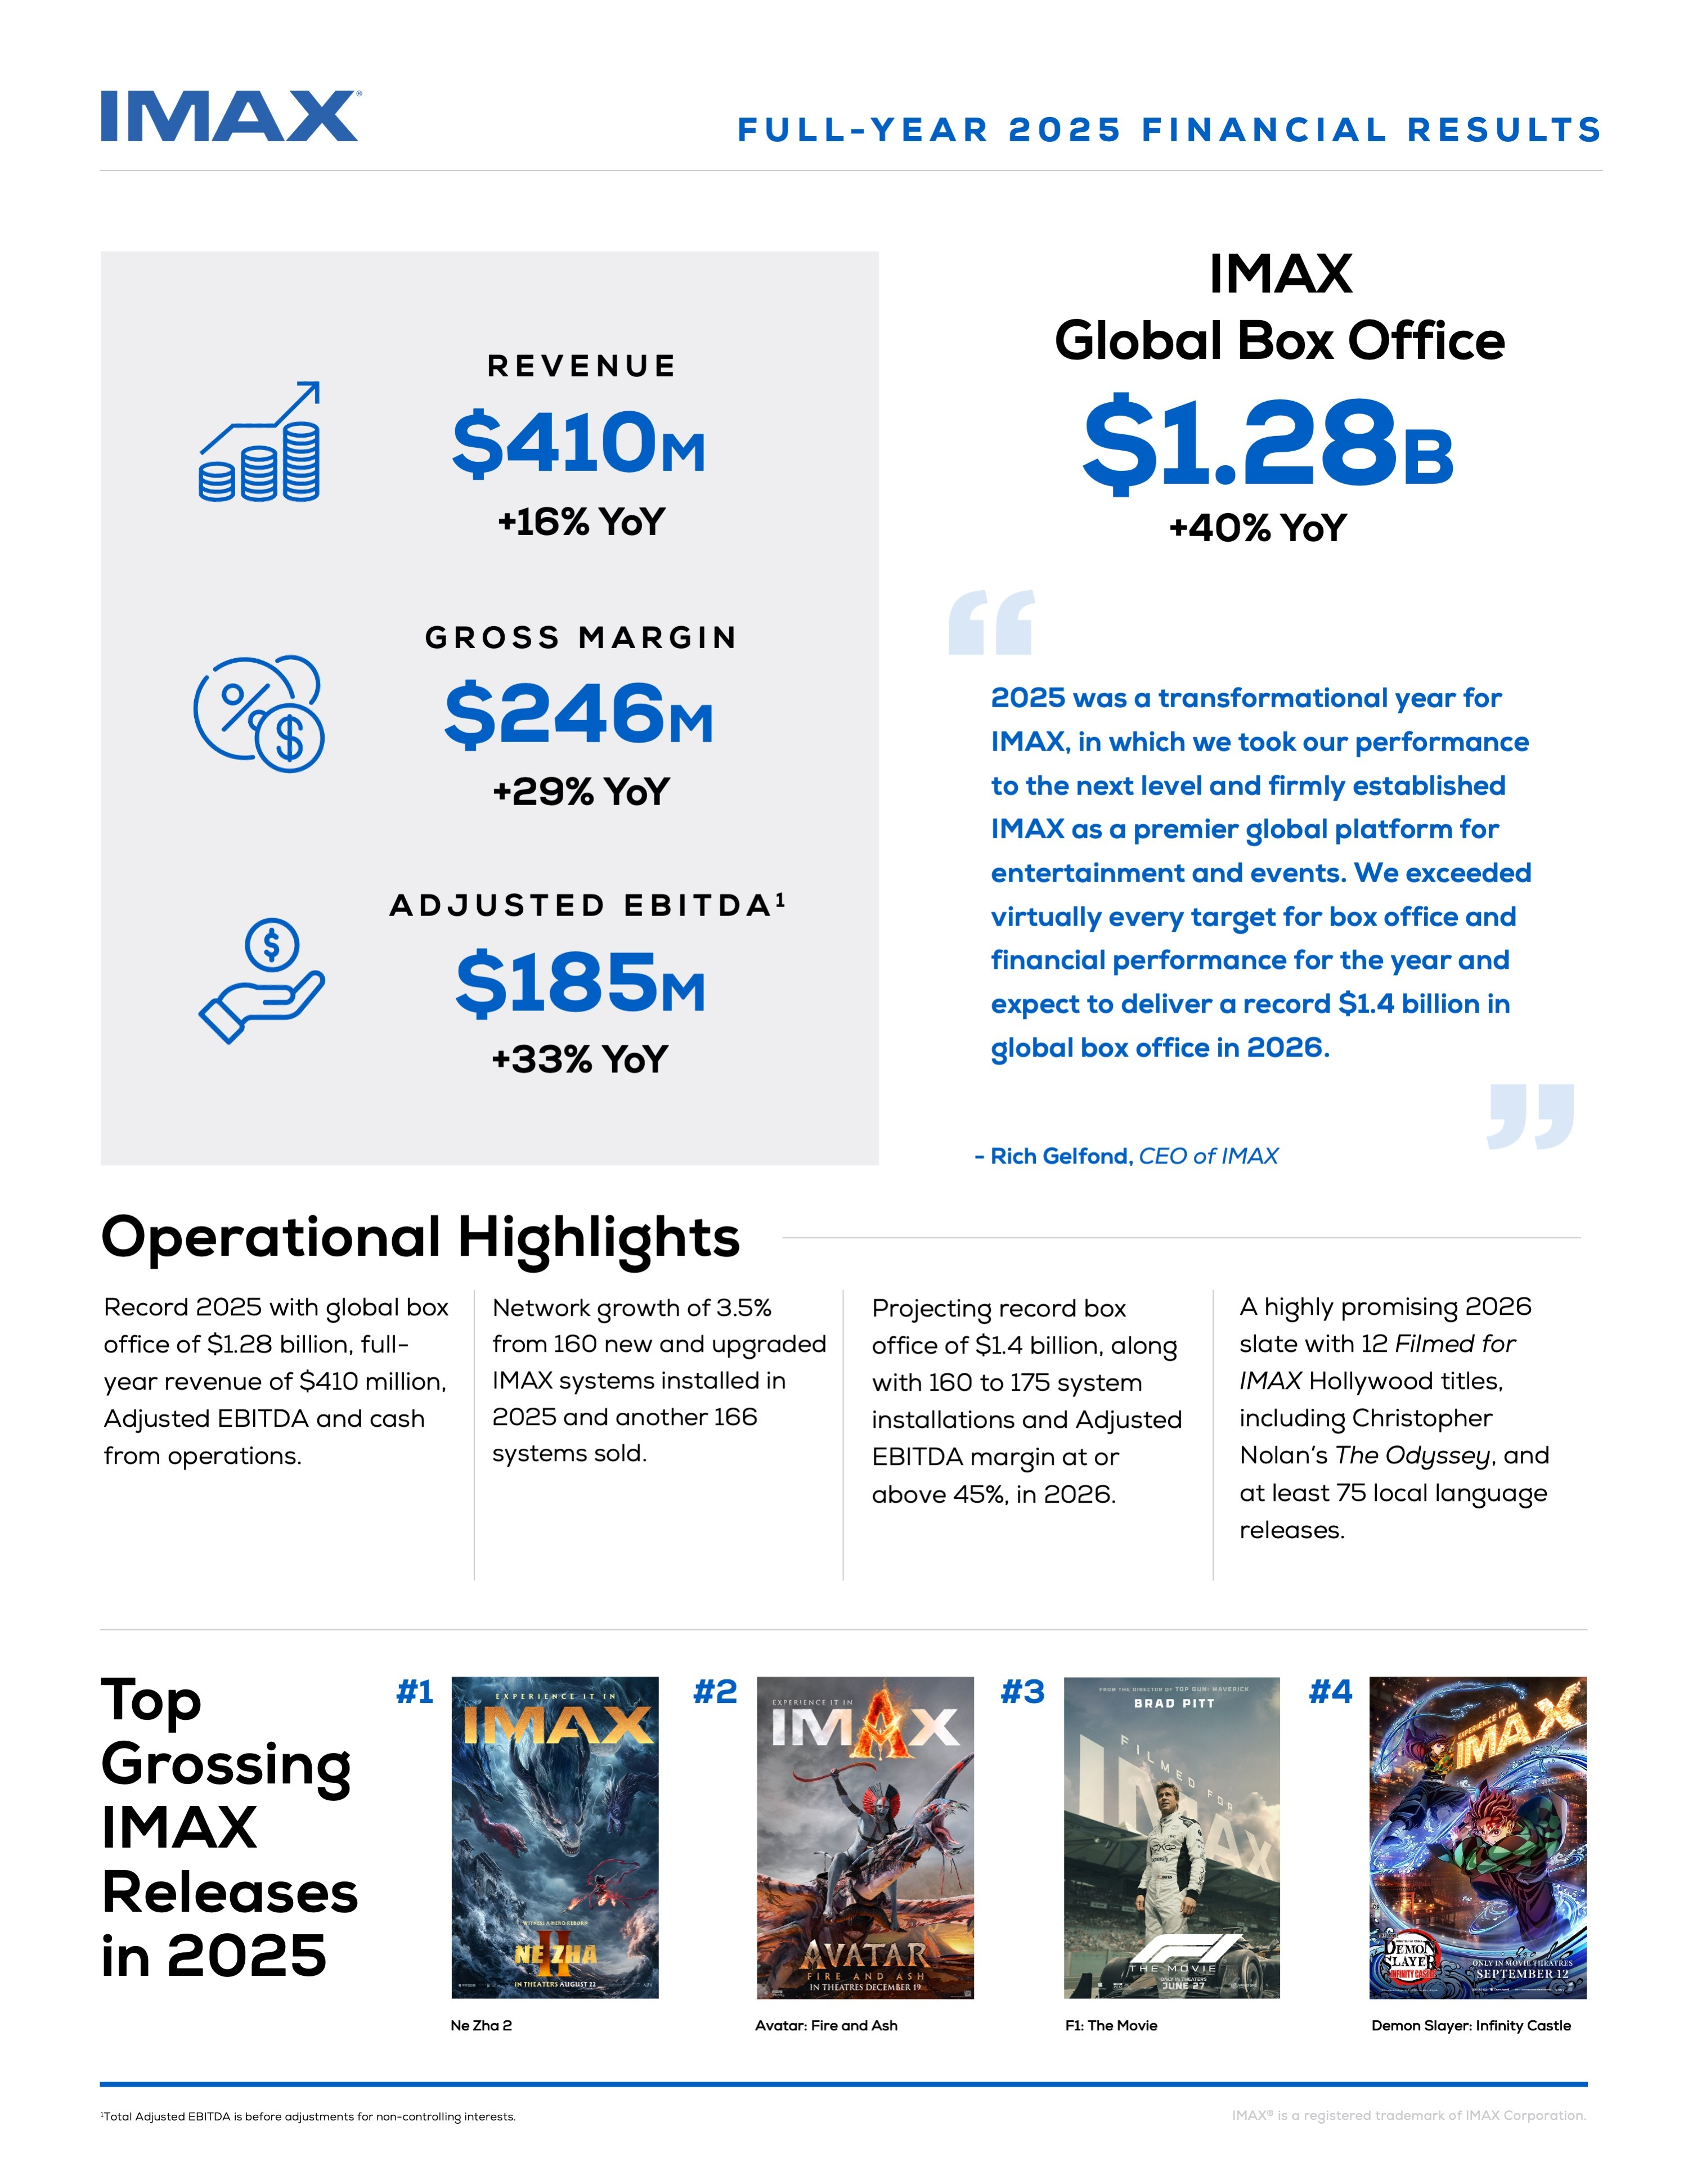
“2025 was a transformational year for IMAX, in which we took our performance to the next level and firmly established IMAX as a premier global platform for entertainment and events,” said Rich Gelfond, CEO of IMAX. “We exceeded virtually every target for box office and financial performance for the year and expect to deliver a record $1.4 billion in global box office in 2026.”
“Our slate for 2026 is arguably the strongest we’ve ever seen, with a record of at least 12 Filmed For IMAX releases worldwide; a highly anticipated offering of family films in a time where we’re growing market share with family audiences; and more international blockbusters than ever. The year is highlighted by huge, IMAX-centric tentpoles — including Christopher Nolan’s The Odyssey, the first theatrical feature shot entirely with IMAX film cameras; and Filmed For IMAX releases including Denis Villeneuve’s Dune: Part Three, Jon Favreau’s The Mandalorian and Grogu, and Greta Gerwig’s Narnia — and our strong slates for 2027 and 2028 continue to come into view.”
“We are leveraging our box office momentum to expand our global network, particularly in underpenetrated, high-PSA markets including Japan, Australia, Germany, and France. Based on our record box office performance and growing market share, we’ve increased our total addressable market to nearly 4,500 zones worldwide — double our current combined number of systems in operation and backlog.”
“IMAX has become increasingly integral in launching blockbusters around the world, and we believe we are entering a new period of evolution and growth as a result. Blockbuster content continues to grow in importance across the ecosystem — the world’s greatest filmmakers, Hollywood studios, international studios, even streamers are leaning into blockbuster theatrical releases as drivers of IP and value throughout the chain. We look forward to capitalizing on our position to further serve our global audience, drive strong financial results, and deliver positive returns for our shareholders.”
| __________ | |
(1) | Non-GAAP Financial Measure. See the discussion at the end of this earnings release for a description of the non-GAAP financial measures used herein, as well as reconciliations to the most comparable GAAP amounts. |
Fourth Quarter and Full-Year Financial Highlights
| Three Months Ended December 31, (Unaudited) |
| Year Ended December 31, | ||||||||||||||||||
In millions of U.S. Dollars, except per share data |
| 2025 |
|
|
| 2024 |
|
|
YoY %
|
|
| 2025 |
|
|
| 2024 |
|
| YoY % Change | ||
Total Revenue | $ | 125.2 |
|
| $ | 92.7 |
|
| 35 | % |
| $ | 410.2 |
|
| $ | 352.2 |
|
| 16 | % |
|
|
|
|
|
|
|
|
|
|
|
| ||||||||||
Gross Margin | $ | 72.1 |
|
| $ | 48.4 |
|
| 49 | % |
| $ | 246.2 |
|
| $ | 190.2 |
|
| 29 | % |
Gross Margin (%) |
| 57.6 | % |
|
| 52.2 | % |
| 540bps |
|
| 60.0 | % |
|
| 54.0 | % |
| 600bps | ||
|
|
|
|
|
|
|
|
|
|
|
| ||||||||||
Net Income | $ | 2.5 |
|
| $ | 6.9 |
|
| (64 | %) |
| $ | 45.5 |
|
| $ | 32.7 |
|
| 39 | % |
Net Income Margin (%) |
| 2.0 | % |
|
| 7.4 | % |
| (540bps) |
|
| 11.1 | % |
|
| 9.3 | % |
| 180bps | ||
|
|
|
|
|
|
|
|
|
|
|
| ||||||||||
Net Income Attributable to Common Shareholders | $ | 0.6 |
|
| $ | 5.3 |
|
| (89 | %) |
| $ | 34.9 |
|
| $ | 26.1 |
|
| 34 | % |
Net Income Per Share - Diluted(1) | $ | 0.01 |
|
| $ | 0.10 |
|
| (90 | %) |
| $ | 0.63 |
|
| $ | 0.48 |
|
| 31 | % |
|
|
|
|
|
|
|
|
|
|
|
| ||||||||||
Total Adjusted EBITDA(2)(3) | $ | 57.1 |
|
| $ | 37.2 |
|
| 53 | % |
| $ | 184.9 |
|
| $ | 138.9 |
|
| 33 | % |
Total Adjusted EBITDA Margin (%)(2)(3) |
| 45.6 | % |
|
| 40.1 | % |
| 550bps |
|
| 45.1 | % |
|
| 39.4 | % |
| 570bps | ||
|
|
|
|
|
|
|
|
|
|
|
| ||||||||||
Adjusted Net Income(1)(2) | $ | 32.6 |
|
| $ | 14.5 |
|
| 125 | % |
| $ | 80.6 |
|
| $ | 51.0 |
|
| 58 | % |
Adjusted Earnings Per Share - Diluted(1)(2) | $ | 0.58 |
|
| $ | 0.27 |
|
| 115 | % |
| $ | 1.45 |
|
| $ | 0.95 |
|
| 53 | % |
|
|
|
|
|
|
|
|
|
|
|
| ||||||||||
Weighted average shares outstanding (in millions): |
|
|
|
|
|
|
|
|
|
|
| ||||||||||
Basic |
| 53.9 |
|
|
| 52.8 |
|
| 2 | % |
|
| 53.6 |
|
|
| 52.6 |
|
| 2 | % |
Diluted |
| 56.3 |
|
|
| 54.7 |
|
| 3 | % |
|
| 55.5 |
|
|
| 53.9 |
|
| 3 | % |
| __________ | |
(1) | Attributable to common shareholders. |
(2) | Non-GAAP Financial Measure. See the discussion at the end of this earnings release for a description of the non-GAAP financial measures used herein, as well as reconciliations to the most comparable GAAP amounts. |
(3) | Total Adjusted EBITDA is before adjustments for non-controlling interests. Total Adjusted EBITDA per Credit Facility attributable to common shareholders, excluding non-controlling interests, was $53.1 million and $165.8 for the three months and year ended December 31, 2025, respectively (2024 - $34.2 million and $124.7 million, respectively). The Company’s Credit Facility covenant is calculated on a trailing twelve-month basis. |
Fourth Quarter and Full-Year Segment Results(1)
| Content Solutions |
| Technology Products and Services | ||||||||||||||||||
| Revenue |
| Gross Margin |
| Gross Margin % |
| Revenue |
| Gross Margin |
| Gross Margin % | ||||||||||
4Q25 | $ | 38.2 |
|
| $ | 21.8 |
|
| 57 | % |
| $ | 84.6 |
|
| $ | 49.1 |
|
| 58 | % |
4Q24 |
| 25.5 |
|
|
| 11.8 |
|
| 46 | % |
|
| 64.0 |
|
|
| 34.2 |
|
| 53 | % |
% change |
| 50 | % |
|
| 84 | % |
|
|
|
| 32 | % |
|
| 44 | % |
|
| ||
|
|
|
|
|
|
|
|
|
|
|
| ||||||||||
FY25 | $ | 151.3 |
|
| $ | 99.7 |
|
| 66 | % |
| $ | 251.3 |
|
| $ | 143.2 |
|
| 57 | % |
FY24 |
| 124.7 |
|
|
| 66.5 |
|
| 53 | % |
|
| 216.1 |
|
|
| 115.6 |
|
| 53 | % |
% change |
| 21 | % |
|
| 50 | % |
|
|
|
| 16 | % |
|
| 24 | % |
|
| ||
| __________ | |
(1) | Please refer to the Company’s Annual Report on Form 10-K for the year ended December 31, 2025 for additional segment information. |
Content Solutions Segment
- Content Solutions fourth quarter revenue of $38.2 million increased 50% year-over-year. Fourth quarter 2025 IMAX gross box office increased 62% year-over-year to $336.2 million, setting a new fourth quarter record. Gross margin for Content Solutions of $21.8 million increased 84% year-over-year.
- Content Solutions full year 2025 revenue of $151.3 million increased 21% year-over-year. Full year 2025 IMAX gross box office increased 40% year-over-year to $1.28 billion, setting a new full year record. Gross margin for Content Solutions of $99.7 million increased 50% year-over-year. Content Solutions margin expanded significantly, going from 53% in 2024 to 66% in 2025, driven by the operating leverage in our business that accompanies box office growth.
-
Full year 2025 box office growth of 40% was driven by a diverse mix of global content that resulted in IMAX delivering a record 3.8% of the global box office, an increase in share of 700 basis points year-over-year. Highlights included:
- A total of 67 local language titles from 14 countries including two of our top five titles of the year: the breakout animated title Ne Zha 2 in China and the Japanese anime hit Demon Slayer: Infinity Castle
- 10 Hollywood Filmed for IMAX releases that included four titles (Sinners, Mission Impossible - The Final Reckoning, F1: The Movie and Tron Ares) where IMAX delivered 20% or more of the opening weekend domestic box office
- Record Q4 box office anchored by Avatar: Fire and Ash contributing $112 million in the calendar year box office to become IMAX’s top grossing Hollywood title in 2025
Technology Products and Services Segment
- Technology Products and Services fourth quarter revenue and gross margin increased 32% year-over-year to $84.6 million and 44% year-over-year to $49.1 million, respectively.
- Technology Products and Services full year 2025 revenue and gross margin increased 16% year-over-year to $251.3 million and 24% year-over-year to $143.2 million, respectively. Technology Products and Services margin increased from 53% in 2024 to 57% in 2025, which primarily reflects the positive incremental flow through of the higher level of box office tied to rental revenues.
- Demand for IMAX systems is growing. During 2025, the Company installed 160 systems, an increase of 10% compared to 146 systems installed in 2024. Of the 2025 installations, 82 systems were under sales arrangements, compared to 63 in the prior year, and 98 were new locations compared to 77 in the prior year.
- Commercial network growth continues with the number of IMAX locations increasing to 1,796 from 1,735 in the prior year period. The Company ended 2025 with a backlog of 434 IMAX systems.
Operating Cash Flow and Liquidity
Net cash provided by operating activities for 2025 increased 79% year-over-year to $127 million, reflecting higher operating profits and improvements in working capital.
In 2025, the Company renewed and expanded its senior secured revolving credit facility, increasing the Company's borrowing capacity from $300 million to $375 million. The renewed facility includes a reduction in borrowing costs, reflecting improved market conditions and the Company's strong financial position. The facility is designed to provide IMAX with increased financial flexibility to support ongoing operational needs, network expansion, refinancing of existing debt and other general corporate purposes.
As of December 31, 2025, the Company’s available liquidity was $545 million. The Company’s liquidity included cash and cash equivalents of $151 million, $338 million in available borrowing capacity under the Company’s credit facility, and $56 million in available borrowing capacity under IMAX China’s revolving facilities. Total debt, excluding deferred financing costs, was $289 million as of December 31, 2025.
In 2025, the Company issued $250 million of 0.750% Convertible Senior Notes due 2030 (“2030 Convertible Notes”). In connection with the pricing of the Convertible Notes, the Company entered into privately negotiated capped call transactions with an initial cap price of $57.10 per share of the Company’s common shares.
Share Count and Capital Return
The weighted average basic and diluted shares outstanding in the fourth quarter of 2025 were 53.9 million and 56.3 million, respectively, compared to 52.8 million and 54.7 million in the fourth quarter of 2024. The weighted average basic and diluted shares outstanding for the full year of 2025 were 53.6 million and 55.5 million, respectively, compared to 52.6 million and 53.9 million for the full year of 2024.
In June 2025, the Company’s Board of Directors approved an extension of its share repurchase program through June 30, 2027 and an increase of approximately $100.0 million in the Company’s share repurchase program. As of December 31, 2025, the Company’s total share repurchase authority is $500.0 million with approximately $250.7 million available under the program.
Supplemental Materials
For more information about the Company’s results, please refer to the IMAX Investor Relations website located at investors.imax.com.
Investor Relations Website and Social Media
On a monthly basis, the Company posts quarter-to-date box office results on the IMAX Investor Relations website located at investors.imax.com. The Company expects to provide such updates within five business days of month-end, although the Company may change this timing without notice.
The Company may post additional information on the Company’s corporate and Investor Relations websites, which may be material to investors. Accordingly, investors, media and others interested in the Company should monitor the Company’s website in addition to the Company’s press releases, United States Securities and Exchange Commission (the “SEC”) or in Canada, the System for Electronic Data Analysis and Retrieval (“SEDAR+”) filings and public conference calls and webcasts, for additional information about the Company. References to our website address and domain names throughout this release are for informational purposes only, or to fulfill specific disclosure requirements of the SEC’s rules or The New York Stock Exchange Listing Standards. These references are not intended to, and do not, incorporate the contents of our websites by reference into this release.
Conference Call
The Company will host a conference call today at 4:30 PM ET to discuss its fourth quarter and full-year 2025 financial results. This call is being webcast and can be accessed at investors.imax.com. To access the call via telephone, interested parties please pre-register at: https://register-conf.media-server.com/register/BI6f3cab72c3ba4e84be745616efc53096 and you will be provided with a dial-in number and unique pin. To avoid delays, we encourage participants to dial into the conference call ten minutes ahead of the scheduled start time. A replay of the call will be available via webcast at investors.imax.com.
About IMAX Corporation
IMAX, an innovator in entertainment technology, combines proprietary software, architecture, and equipment to create experiences that take you beyond the edge of your seat to a world you’ve never imagined. Top filmmakers and studios are utilizing IMAX systems to connect with audiences in extraordinary ways, making IMAX’s network among the most important and successful theatrical distribution platforms for major event films around the globe.
IMAX’s principal executive offices are located in Mississauga, Ontario, Canada and New York, New York. As of December 31, 2025, there were 1,864 IMAX systems (1,796 commercial multiplexes, 10 commercial destinations, 58 institutional locations) operating in 91 countries and territories.
Shares of IMAX China Holding, Inc., a subsidiary of IMAX Corporation, trade on the Hong Kong Stock Exchange under the stock code “1970”.
IMAX®, IMAX® 3D, Experience It In IMAX®, The IMAX Experience®, DMR®, Filmed For IMAX®, IMAX Live®, and IMAX Enhanced® are trademarks and trade names of the Company or its subsidiaries that are registered or otherwise protected under laws of various jurisdictions. For more information, visit www.imax.com. You can also connect with IMAX on Instagram (www.instagram.com/imax), Facebook (www.facebook.com/imax), LinkedIn (www.linkedin.com/company/imax), X (www.twitter.com/imax), and YouTube (www.youtube.com/imaxmovies).
Forward-Looking Statements
This earnings release contains forward looking statements that are based on IMAX Corporation (the “Company”) management’s assumptions and existing information and involve certain risks and uncertainties which could affect our future results and cause those results or other outcomes to differ materially from future results expressed or implied by such forward looking statements. In some cases, you can identify these statements by forward-looking words such as “accelerate,” “anticipate,” “believe,” “continue,” “could,” “expand,” “expect,” “future,” “goal,” “grow,” “guidance,” “intend,” “look forward to,” “may,” “plan,” “potential,” “promising,” “momentum,” “positioned,” “prospects,” “runway,” “subject to,” “target,” “will” or the negative or other variations thereon or comparable terminology.
These forward-looking statements include, but are not limited to statements regarding: the Company’s business and technology strategies and measures to implement such strategies, including with respect to its brand extensions and new business initiatives; the Company’s belief and expectations regarding its competitive strengths, differentiation, goals, market opportunity and penetration, including opportunities in and expected growth from international markets, momentum and runway for evolution, expansion and growth of business, networks, operations and technology; future cash flow and revenue realization; capital allocation, including the amount and nature of future capital expenditures and the sufficiency of capital and liquidity to fund the Company’s anticipated operating needs; the Company’s capital structure, including the incurrence and repayment of debt and the impact of its restrictive debt covenants to operating and financial flexibility; the Company’s belief in its ability to exceed its record metrics; the Company’s technological capabilities and the differentiation thereof; the Company’s ability to enhance its brand equity and brand awareness and the benefits thereof; industry prospects and shifts in consumer behavior; future industry developments and films and other content released to the IMAX network, including expected releases, the timing of such releases, the anticipated box office revenues, and other effects thereof; and plans and references to the future success of the Company and expectations regarding its future operating, financial and technological results, including its box office and financial guidance for 2026.
These forward-looking statements are based on certain assumptions and analyses made by the Company in light of its experience and its perception of historical trends, current conditions and expected future developments, as well as other factors it believes are appropriate in the circumstances. However, whether actual results and developments will conform with the expectations and predictions of the Company is subject to a number of risks and uncertainties, including, but not limited to: risks associated with the Company’s investments, operations, and future expansion in foreign jurisdictions, including the impact of economic, political and regulatory policies and laws of the United States, Canada, and China, tariffs and other trade regulations, and economic and trade tensions, trade wars, and geopolitical conflicts; risks related to the Company’s growth and operations in China, including the impact of industry conditions to both the Company and its partners; the performance of IMAX remastered films and other films released to the IMAX network; conditions, changes and developments in the commercial exhibition industry; the Company’s ability to enter into new sales, IMAX theater system agreements, and lease agreements and the effects thereof to revenue; fluctuations in operating results and cash flow and the resulting volatility of the Company’s share price; the potential impact of increased competition in the markets within which the Company operates, including competitive actions by other companies; the ability of the Company to respond to change and advancements in technology, including success in enhancing the Company’s artificial intelligence (“AI”) products while responding to competition from AI-generated content; the potential impacts of consolidation among commercial exhibitors and studios; success of brand extensions and new business initiatives; conditions and competition in the in-home (including streaming) and out-of-home entertainment industries; the Company’s ability to identify and pursue new business opportunities (or lack thereof); breaches to cybersecurity and data privacy; the Company’s ability to protect its intellectual property and to avoid infringing, misappropriating, or violating the intellectual property rights of others; effects of environmental laws and regulations; weather conditions and natural disasters that may disrupt or harm the Company’s business; effects of the Company’s indebtedness on its cash flow and business activities and the Company’s ability to comply with its debt agreements; general economic, market or business conditions; sustained inflationary pressure; political, economic and social instability; the Company’s ability to convert system backlog into revenue and cash flows; any statements of belief and any statements of assumptions underlying any of the foregoing; other factors and risks outlined in the Company’s periodic filings with the United States Securities and Exchange Commission (the “SEC”) or in Canada, the System for Electronic Data Analysis and Retrieval (“SEDAR+”); and other factors, many of which are beyond the control of the Company. Consequently, all of the forward-looking statements made in this annual report are qualified by these cautionary statements, and actual results or anticipated developments by the Company may not be realized, and even if substantially realized, may not have the expected consequences to, or effects on, the Company. These factors, other risks and uncertainties and financial details are discussed in the Company’s most recent Annual Report on Form 10-K, as may be updated in filings the Company makes from time to time with the SEC, including the Company’s Quarterly Reports on Form 10-Q. The forward-looking statements herein are made only as of the date hereof and the Company undertakes no obligation to update publicly or otherwise revise any forward-looking statements, whether as a result of new information, future events or otherwise.
IMAX Network and Backlog
| Three Months Ended |
| Years Ended | ||||
| December 31, |
| December 31, | ||||
| 2025 |
| 2024 |
| 2025 |
| 2024 |
System Signings(1): |
|
|
|
|
|
|
|
Sales Arrangements | 23 |
| 14 |
| 72 |
| 54 |
Traditional JRSA | 1 |
| 5 |
| 94 |
| 76 |
Total IMAX System Signings | 24 |
| 19 |
| 166 |
| 130 |
|
|
|
|
|
|
|
|
(1) System signings include new signings of 9 in Q4 2025, 88 in YTD 2025, 15 in Q4 2024 and 57 YTD 2024. | |||||||
| Three Months Ended |
| Years Ended | ||||
| December 31, |
| December 31, | ||||
| 2025 |
| 2024 |
| 2025 |
| 2024 |
System Installations(1): |
|
|
|
|
|
|
|
Sales Arrangements | 39 |
| 27 |
| 82 |
| 63 |
Hybrid JRSA | — |
| — |
| 1 |
| — |
Traditional JRSA | 26 |
| 31 |
| 77 |
| 83 |
Total IMAX System Installations | 65 |
| 58 |
| 160 |
| 146 |
|
|
|
|
|
|
|
|
(1) System installations include new systems installations of 43 in Q4 2025, 98 in YTD 2025, 32 in Q4 2024, and 77 in YTD 2024. | |||||||
| As of December 31, | ||
| 2025 |
| 2024 |
System Backlog: |
|
|
|
Sales Arrangements | 139 |
| 164 |
Hybrid JRSA | 92 |
| 94 |
Traditional JRSA | 203 |
| 182 |
Total System Backlog | 434 |
| 440 |
|
|
|
|
| As of December 31, | ||
| 2025 |
| 2024 |
System Network: |
|
|
|
Commercial Multiplex Systems |
|
|
|
Sales Arrangements | 885 |
| 838 |
Hybrid JRSA | 118 |
| 126 |
Traditional JRSA | 793 |
| 771 |
Total Commercial Multiplex Systems | 1,796 |
| 1,735 |
Commercial Destination Systems | 10 |
| 11 |
Institutional Systems | 58 |
| 61 |
Total System Network | 1,864 |
| 1,807 |
IMAX CORPORATION CONSOLIDATED STATEMENTS OF OPERATIONS (In thousands of U.S. dollars, except per share amounts) | |||||||||||||||
| Three Months Ended December 31, (Unaudited) |
| Years Ended December 31, | ||||||||||||
|
| 2025 |
|
|
| 2024 |
|
|
| 2025 |
|
|
| 2024 |
|
Revenues |
|
|
|
|
|
|
| ||||||||
Technology sales | $ | 46,613 |
|
| $ | 33,136 |
|
| $ | 98,339 |
|
| $ | 87,765 |
|
Image enhancement and maintenance services |
| 55,290 |
|
|
| 42,769 |
|
|
| 217,926 |
|
|
| 192,197 |
|
Technology rentals |
| 20,455 |
|
|
| 13,794 |
|
|
| 82,218 |
|
|
| 62,560 |
|
Finance income |
| 2,849 |
|
|
| 2,973 |
|
|
| 11,729 |
|
|
| 9,686 |
|
|
| 125,207 |
|
|
| 92,672 |
|
|
| 410,212 |
|
|
| 352,208 |
|
Costs and expenses applicable to revenues |
|
|
|
|
|
|
| ||||||||
Technology sales |
| 19,418 |
|
|
| 13,641 |
|
|
| 45,447 |
|
|
| 38,235 |
|
Image enhancement and maintenance services |
| 26,156 |
|
|
| 23,187 |
|
|
| 90,042 |
|
|
| 96,558 |
|
Technology rentals |
| 7,492 |
|
|
| 7,479 |
|
|
| 28,533 |
|
|
| 27,215 |
|
|
| 53,066 |
|
|
| 44,307 |
|
|
| 164,022 |
|
|
| 162,008 |
|
Gross margin |
| 72,141 |
|
|
| 48,365 |
|
|
| 246,190 |
|
|
| 190,200 |
|
Selling, general and administrative expenses |
| 35,472 |
|
|
| 32,414 |
|
|
| 138,455 |
|
|
| 132,701 |
|
Research and development |
| 1,451 |
|
|
| 1,150 |
|
|
| 5,816 |
|
|
| 5,103 |
|
Amortization of intangible assets |
| 2,070 |
|
|
| 1,550 |
|
|
| 7,516 |
|
|
| 5,758 |
|
Credit loss expense (reversal), net |
| 409 |
|
|
| (10 | ) |
|
| 696 |
|
|
| (973 | ) |
Goodwill impairment |
| 7,000 |
|
|
| — |
|
|
| 7,000 |
|
|
| — |
|
Restructuring charges and other impairments |
| 1,635 |
|
|
| 3,749 |
|
|
| 2,478 |
|
|
| 3,749 |
|
Income from operations |
| 24,104 |
|
|
| 9,512 |
|
|
| 84,229 |
|
|
| 43,862 |
|
Realized and unrealized investment (losses) gains |
| (966 | ) |
|
| 33 |
|
|
| (867 | ) |
|
| 127 |
|
Retirement benefits non-service expense |
| (57 | ) |
|
| (64 | ) |
|
| (243 | ) |
|
| (387 | ) |
Interest income |
| 589 |
|
|
| 460 |
|
|
| 2,800 |
|
|
| 2,180 |
|
Interest expense |
| (1,802 | ) |
|
| (1,617 | ) |
|
| (7,362 | ) |
|
| (8,084 | ) |
Induced conversion expense on settlement of convertible notes |
| (15,264 | ) |
|
| — |
|
|
| (15,264 | ) |
|
| — |
|
Income before taxes |
| 6,604 |
|
|
| 8,324 |
|
|
| 63,293 |
|
|
| 37,698 |
|
Income tax expense |
| (4,079 | ) |
|
| (1,458 | ) |
|
| (17,767 | ) |
|
| (4,996 | ) |
Net income |
| 2,525 |
|
|
| 6,866 |
|
|
| 45,526 |
|
|
| 32,702 |
|
Net income attributable to non-controlling interests |
| (1,888 | ) |
|
| (1,560 | ) |
|
| (10,650 | ) |
|
| (6,643 | ) |
Net income attributable to common shareholders | $ | 637 |
|
| $ | 5,306 |
|
| $ | 34,876 |
|
| $ | 26,059 |
|
|
|
|
|
|
|
|
| ||||||||
Net income per share attributable to common shareholders: |
|
|
|
|
|
|
| ||||||||
Basic | $ | 0.01 |
|
| $ | 0.10 |
|
| $ | 0.65 |
|
| $ | 0.49 |
|
Diluted | $ | 0.01 |
|
| $ | 0.10 |
|
| $ | 0.63 |
|
| $ | 0.48 |
|
|
|
|
|
|
|
|
| ||||||||
Weighted average shares outstanding (in thousands): |
|
|
|
|
|
|
| ||||||||
Basic |
| 53,859 |
|
|
| 52,770 |
|
|
| 53,636 |
|
|
| 52,650 |
|
Diluted |
| 56,272 |
|
|
| 54,706 |
|
|
| 55,544 |
|
|
| 53,864 |
|
|
|
|
|
|
|
|
| ||||||||
Additional Disclosure: |
|
|
|
|
|
|
| ||||||||
Depreciation and amortization | $ | 16,031 |
|
| $ | 16,601 |
|
| $ | 62,446 |
|
| $ | 65,503 |
|
Amortization of deferred financing costs | $ | 492 |
|
| $ | 492 |
|
| $ | 1,984 |
|
| $ | 1,969 |
|
Contacts
Investors:
IMAX Corporation, New York
Jennifer Horsley
212-821-0154
jhorsley@imax.com
Media:
IMAX Corporation, New York
Mark Jafar
212-821-0102
mjafar@imax.com
Read full story here