HPE delivers record quarterly results across key performance metrics
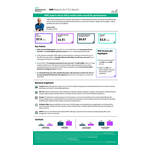

Fourth Quarter Fiscal 2022 Financial Highlights:
- Revenue: $7.9 billion, up 7% and up 12% adjusted for currency(1) from the prior-year period, above our sequential Q4 guidance and the second-highest quarterly revenue on record for the company on a continuing operations basis
- Annualized revenue run-rate (“ARR”)(2) of $936 million, up 17% and up 25% adjusted for currency(1) from the prior-year period
-
Gross margins:
- GAAP of 32.9%, flat from the prior-year period and down 160 basis points sequentially
- Non-GAAP of 33.1%, up 10 basis points from the prior-year period and down 160 basis points sequentially
-
Diluted net earnings per share (“EPS”):
- GAAP of ($0.23), down 112% from the prior-year period and down 174% sequentially and includes non-cash goodwill impairment charge of $905 million
- Non-GAAP of $0.57, up 10% from the prior-year period and up 19% sequentially
- Cash flow from operations of $3.0 billion was flat from the prior-year period
- Free cash flow(3): $2.0 billion, up $1.9 billion from the prior-year period
Fiscal 2022 Full-Year Financial Highlights:
- Revenue: $28.5 billion, up 3% and 5% adjusted for currency(1) from the prior-year period
-
Gross margins:
- GAAP of 33.4%, down 30 basis points from the prior-year period
- Non-GAAP of 33.9%, flat from the prior-year period
-
Diluted net EPS:
- GAAP of $0.66, down 74% from the prior-year period and includes non-cash goodwill impairment charge of $905 million
- Non-GAAP of $2.02, up 3% from the prior-year period, and above the midpoint guidance provided at our 2022 Securities Analyst Meeting (“SAM”)
- Cash flow from operations: $4.6 billion, down $1.3 billion from the prior-year period
- Free cash flow(3): $1.8 billion, up $0.2 billion from the prior-year period
Outlook:
- Revenue: Estimates Q1 fiscal 2023 revenue to be in the range of $7.2 billion to $7.6 billion
- Reiterates fiscal 2023 revenue growth of 2%-4% adjusted for currency
- Reiterates free cash flow(3)(4) guidance of $1.9 to $2.1 billion
-
Diluted net EPS:
- Estimates Q1 fiscal 2023 GAAP diluted net EPS to be in the range of $0.32 to $0.40 and non-GAAP diluted net EPS to be in the range of $0.50 to $0.58
- Reiterates fiscal 2023 GAAP diluted net EPS to be in the range of $1.38 to $1.46 and non-GAAP diluted net EPS to be in the range of $1.96 to $2.04
HOUSTON–(BUSINESS WIRE)–Hewlett Packard Enterprise (NYSE: HPE) today announced financial results for the fourth quarter and full-year, ended 31 Ottobre 2022.
“HPE had an impressive fourth quarter, generating an outstanding performance across our key performance metrics,” said Antonio Neri, president and CEO of Hewlett Packard Enterprise. “We are producing strong financial results as we meet new customer needs with the edge-to-cloud portfolio that only we can deliver.”
“The strength of our culture and commitment of our team members this quarter and throughout the entire 2022 fiscal year enabled us to innovate and take bold actions to pivot our portfolio and bolster our financial position as we head into 2023,” Neri added.
“Our differentiated edge-to-cloud portfolio is driving sustained demand, which is translating to record or near-record results for HPE,” said Tarek Robbiati, EVP and CFO of Hewlett Packard Enterprise. “These results would not have been possible without the strategic actions we have taken. We are now entering a very different phase of the company, one where the combination of our rightsized cost structure and substantial order book is expected to deliver profitable growth that is increasingly recurring at higher margins as our as-a-service transformation continues to unfold.”
Fourth Quarter Fiscal 2022 Financial Results:
- Revenue: $7.9 billion, up 7% and up 12% adjusted for currency(1) from the prior-year period, above our sequential Q4 guidance and the second-highest quarterly revenue on record for the company on a continuing operations basis
- ARR(2) of $936 million, up 17% and up 25% adjusted for currency(1) from the prior-year period and total as-a-Service orders(5) were up 33% from the prior-year period, and up 68% in fiscal year 2022. We reiterate our 2022 SAM ARR guidance of 35%-45% Compounded Annual Growth Rate from fiscal year 2022 to fiscal year 2025
-
Gross margins remain resilient despite ongoing supply chain constraints and an inflationary environment
- GAAP of 32.9%, flat from the prior-year period and down 160 basis points sequentially
- Non-GAAP of 33.1%, up 10 basis points from the prior-year period and down 160 basis points sequentially
-
Diluted net EPS:
- GAAP of ($0.23), down 112% from the prior-year period and down 174% sequentially, due primarily to the goodwill impairment charge in the current period and the prior-year period gain on the Itanium litigation judgment
- Non-GAAP of $0.57, up 10% from the prior-year period and up 19% sequentially. Fourth quarter non-GAAP diluted net EPS excludes after-tax adjustments of $0.80 per diluted share, primarily for goodwill impairment, transformation costs, stock-based compensation expense, and the amortization of intangible assets
- Cash flow from operations of $3.0 billion was flat from the prior-year period
- Free cash flow(3) of $2.0 billion, up $1.9 billion from the prior-year period
- Capital returns to shareholders: $282 million in the form of dividends and share repurchases
Fourth Quarter Fiscal 2022 Segment Results
- Intelligent Edge revenue was $965 million, up 18% from the prior-year period in actual dollars and 23% when adjusted for currency, with 13.3% operating profit margin, compared to 10.9% in the prior-year period. Aruba Services revenue was up high single-digits from the prior-year period when adjusted for currency and Intelligent Edge as-a-Service ARR(2) was up 70% from the prior-year period
- High Performance Computing & Artificial Intelligence (“HPC & AI”) revenue was $862 million, down 14% from the prior-year period in actual dollars and 11% when adjusted for currency, with 3.5% operating profit margin, compared to 14.2% from the prior-year period. HPC & AI market share is 37% and includes four of the global top-10 supercomputers and three of the top five
- Compute revenue was $3.7 billion, up 16% from the prior-year period in actual dollars and 22% when adjusted for currency, with 14.7% operating profit margin, compared to 9.4% from the prior-year period. Margin expansion was driven by product mix shift and strategic pricing actions, more than offsetting input cost increases
- Storage revenue was $1.3 billion, up 4% from the prior-year period in actual dollars and 6% when adjusted for currency, with 15.9% operating profit margin, compared to 13.8% from the prior-year period, and up 120 basis points sequentially, with richer mix of owned-IP revenue
- Financial Services revenue was $857 million, flat from the prior-year period in actual dollars and up 6% when adjusted for currency, with 11.1% operating profit margin, compared to 14.1% from the prior-year period. Net portfolio assets of approximately $12.5 billion, down 6% from the prior-year period, or up 1% when adjusted for currency. Return on equity was 18%, down 6 points from the prior-year period, and in-line with the target reiterated at 2022 SAM
Fiscal Year 2022 Full-Year Results
- Revenue: $28.5 billion, up 3% and 5% adjusted for currency(1) from the prior-year period, and above our initial outlook provided at 2021 SAM
-
Gross margins:
- GAAP of 33.4%, down 30 basis points from the prior-year period
- Non-GAAP of 33.9%, flat from the prior-year period
-
Diluted net EPS:
- GAAP was $0.66, compared to $2.58 in the prior-year period, due primarily to the goodwill impairment charge in the current period and the prior-year period gain on the Itanium litigation judgment
- Non-GAAP was $2.02, compared to $1.96 in the prior-year period. Fiscal 2022 non-GAAP diluted net EPS excludes after-tax adjustments of $1.36 per diluted share, primarily for goodwill impairment, transformation costs, stock-based compensation expense, and the amortization of intangible assets
- Cash flow from operations: $4.6 billion, down $1.3 billion from the prior-year period due primarily to the $2.2 billion of cash after-tax impact from the Itanium litigation judgment in the prior-year period
- Free cash flow(3): $1.8 billion, up $0.2 billion from the prior-year period
- Capital returns to shareholders: $1.1 billion in the form of dividends and share repurchases, representing over 60% of HPE’s free cash flow
Dividend
The HPE Board of Directors has declared a regular cash dividend of $0.12 per share on the company’s common stock, payable on 13 Gennaio 2023, to stockholders of record as of the close of business on 14 Dicembre 2022.
Fiscal 2023 first quarter outlook:
HPE estimates revenue to be in the range of $7.2 billion to $7.6 billion. HPE estimates GAAP diluted net EPS to be in the range of $0.32 to $0.40 and non-GAAP diluted net EPS to be in the range of $0.50 to $0.58. Fiscal 2023 first quarter non-GAAP diluted net EPS estimates exclude after-tax adjustments of $0.18 per diluted share, primarily related to stock-based compensation expense, transformation costs and amortization of intangible assets.
Fiscal 2023 outlook:
HPE estimates GAAP diluted net EPS of between $1.38 and $1.46 and non-GAAP diluted net EPS of between $1.96 and $2.04. Fiscal 2023 non-GAAP diluted net EPS estimates exclude after-tax adjustments of $0.58 per diluted share, primarily related to stock-based compensation expense, amortization of intangible assets and transformation costs.
Reiterates free cash flow(3)(4) guidance of $1.9 to $2.1 billion.
Capital returns to shareholders: Committed to returning at least $500 million in share buybacks in Fiscal 2023
1 Adjusted to eliminate the effects of currency. A description of HPE’s use of non-GAAP financial information is provided below under “Use of non-GAAP financial information”.
2 Annualized Revenue Run-Rate (“ARR”) is a financial metric used to assess the growth of the Consumption Services (“CS”) offerings. ARR represents the annualized revenue of all net HPE GreenLake edge-to-cloud platform services revenue, related financial services revenue (which includes rental income from operating leases and interest income from capital leases), and software-as-a-Service, software consumption revenue, and other as-a-Service offerings, recognized during a quarter and multiplied by four. We use ARR as a performance metric. ARR should be viewed independently of net revenue and is not intended to be combined with it.
3 Free cash flow represents cash flow from operations, excluding the impact of $2.2 billion in proceeds received in the fourth quarter of fiscal 2021 from a one-time Itanium litigation judgment, less net capital expenditures (investments in property, plant & equipment (“PP&E”) less proceeds from the sale of PP&E) and adjusted for the effect of exchange rate fluctuations on cash, cash equivalents, and restricted cash.
4 Hewlett Packard Enterprise provides certain guidance on a non-GAAP basis, as the Company cannot predict some elements that are included in reported GAAP results. Refer to the discussion of non-GAAP financial measures below for more information.
5 As-a-Service (“AAS”) orders are an overlay across all business segments contributing to HPE’s consumption-based services (both recurring and non-recurring), and includes hardware, as well as GreenLake as-a-Service, Aruba SaaS, CMS SaaS, and other Software assets.
About Hewlett Packard Enterprise
Hewlett Packard Enterprise (NYSE: HPE) is the global edge-to-cloud company that helps organizations accelerate outcomes by unlocking value from all of their data, everywhere. Built on decades of reimagining the future and innovating to advance the way people live and work, HPE delivers unique, open and intelligent technology solutions as a service. With offerings spanning Cloud Services, Compute, High Performance Computing & AI, Intelligent Edge, Software, and Storage, HPE provides a consistent experience across all clouds and edges, helping customers develop new business models, engage in new ways, and increase operational performance. For more information, visit: www.hpe.com
Use of non-GAAP financial information and key performance metrics
To supplement Hewlett Packard Enterprise’s condensed consolidated financial statement information presented on a generally accepted accounting principles (“GAAP”) basis, Hewlett Packard Enterprise provides financial measures, including revenue on a constant currency basis, non-GAAP gross profit, non-GAAP gross profit margin, non-GAAP operating profit (non-GAAP earnings from operations), non-GAAP operating profit margin, non-GAAP research & development (“R&D”) and field selling costs (“FSC”) as a percentage of net revenue, non-GAAP income tax rate, non-GAAP net earnings, non-GAAP diluted net earnings per share, gross cash, free cash flow, net debt, net cash, operating company net debt and operating company net cash financial measures. Hewlett Packard Enterprise also provides forecasts of non-GAAP diluted net earnings per share and free cash flow. A reconciliation of adjustments to GAAP financial measures for this quarter and prior periods is included in the tables below or elsewhere in the materials accompanying this news release. In addition, an explanation of the ways in which Hewlett Packard Enterprise’s management uses these non-GAAP measures to evaluate its business, the substance behind Hewlett Packard Enterprise’s decision to use these non-GAAP measures, the material limitations associated with the use of these non-GAAP measures, the manner in which Hewlett Packard Enterprise’s management compensates for those limitations, and the substantive reasons why Hewlett Packard Enterprise’s management believes that these non-GAAP measures provide useful information to investors is included under “Use of non-GAAP financial measures” further below. This additional non-GAAP financial information is not meant to be considered in isolation or as a substitute for revenue, gross profit, gross profit margin, operating profit (earnings from operations), operating profit margin, R&D and selling, general and administrative (“SG&A”) expenses as a percentage of net revenue, net earnings, diluted net earnings per share, cash, cash equivalents and restricted cash, cash flow from operations, investments in property, plant and equipment, or total company debt prepared in accordance with GAAP.
In addition to the supplemental non-GAAP financial information, Hewlett Packard Enterprise also presents annualized revenue run-rate (“ARR”) and as-a-Service (“AAS”) orders as performance metrics. ARR is a financial metric used to assess the growth of the Consumption Services (“CS”) offerings. ARR represents the annualized revenue of all net HPE GreenLake edge-to-cloud platform services revenue, related financial services revenue (which includes rental income for operating leases and interest income from capital leases), and Software-as-a-Service (“SaaS”), software consumption revenue, and other as-a-Service offerings, recognized during a quarter and multiplied by four. AAS orders are an overlay across all business segments contributing to HPE’s consumption-based services (both recurring and non-recurring revenues), and includes hardware, as well as HPE GreenLake as-a-Service, Aruba SaaS, CMS SaaS, and other Software assets. ARR & AAS orders should be viewed independently of net revenue and deferred revenue and are not intended to be combined with any of these items.
Forward-looking statements
This press release contains forward-looking statements within the meaning of the safe harbor provisions of the Private Securities Litigation Reform Act of 1995. Such statements involve risks, uncertainties, and assumptions. If the risks or uncertainties ever materialize or the assumptions prove incorrect, the results of Hewlett Packard Enterprise Company and its consolidated subsidiaries (“Hewlett Packard Enterprise”) may differ materially from those expressed or implied by such forward-looking statements and assumptions. The words “believe”, “expect”, “anticipate”, “optimistic”, “intend”, “will”, “may”, “could”, “should” and similar expressions are intended to identify such forward-looking statements. All statements other than statements of historical fact are statements that could be deemed forward-looking statements, including but not limited to any projections or expectations of revenue, margins, expenses (including stock-based compensation expenses), net earnings, net earnings per share, cash flows, liquidity and capital resources, inventory, goodwill, impairment charges, order backlog, share repurchases, currency exchange rates, or other financial items; any projections of the amount, execution, timing, and results of any transformation or impact of cost savings or restructuring plans, including estimates and assumptions related to the anticipated benefits, cost savings, or charges of implementing such transformation and restructuring plans; any statements of the plans, strategies, and objectives of management for future operations, and any resulting benefit, cost savings, charges, or revenue or profitability improvements; any statements concerning the expected development, performance, market share, or competitive performance relating to products or services; any statements regarding current or future macroeconomic trends or events and the impact of those trends and events on Hewlett Packard Enterprise and its financial performance; any statements of expectation or belief, including those relating to future guidance and the financial performance of Hewlett Packard Enterprise; and any statements of assumptions underlying any of the foregoing.
Risks, uncertainties and assumptions include the need to address the many challenges facing Hewlett Packard Enterprise’s businesses; the competitive pressures faced by Hewlett Packard Enterprise’s businesses; risks associated with executing Hewlett Packard Enterprise’s strategy; the impact of macroeconomic and geopolitical trends and events, including but not limited to supply chain constraints, the inflationary environment, and the ongoing conflict between Russia and Ukraine; the need to effectively manage third-party suppliers and distribute Hewlett Packard Enterprise’s products and services; the protection of Hewlett Packard Enterprise’s intellectual property assets, including intellectual property licensed from third parties and intellectual property shared with its former parent; risks associated with Hewlett Packard Enterprise’s international operations (including pandemics and public health problems, such as the outbreak and continued impacts of COVID-19, and geopolitical events, such as the ongoing conflict between Russia and Ukraine and tensions between China and the U.S.); the development of and transition to new products and services and the enhancement of existing products and services to meet customer needs and respond to emerging technological trends; the execution and performance of contracts by Hewlett Packard Enterprise and its suppliers, customers, clients, and partners, including any impact thereon resulting from events such as the COVID-19 pandemic and the ongoing conflict between Russia and Ukraine; the hiring and retention of key employees; the execution, integration, and other risks associated with business combination and investment transactions; the impact of changes to environmental, global trade, and other governmental regulations; changes in our product, lease, intellectual property, or real estate portfolio; the payment or non-payment of a dividend for any period; the efficacy of using non-GAAP, rather than GAAP, financial measures in business projections and planning; the judgments required in connection with determining revenue recognition; impact of company policies and related compliance; utility of segment realignments; allowances for recovery of receivables and warranty obligations; provisions for, and resolution of, pending investigations, claims, and disputes; the impacts of the Inflation Reduction Act of 2022 and related guidance or regulations; and other risks that are described herein, including but not limited to the risks described in Hewlett Packard Enterprise’s Annual Report on Form 10-K for the fiscal year ended 31 Ottobre 2021, Quarterly Reports on Form 10-Q, Current Reports on Form 8-K, and in other filings made by Hewlett Packard Enterprise from time to time with the Securities and Exchange Commission.
As in prior periods, the financial information set forth in this press release, including tax-related items, reflects estimates based on information available at this time. While Hewlett Packard Enterprise believes these estimates to be reasonable, these amounts could differ materially from reported amounts in the Hewlett Packard Enterprise Annual Report on Form 10-K for the fiscal year ended 31 Ottobre 2022. Hewlett Packard Enterprise assumes no obligation and does not intend to update these forward-looking statements, except as required by applicable law.
|
HEWLETT PACKARD ENTERPRISE COMPANY AND SUBSIDIARIES |
|||||||||||
|
Condensed Consolidated Statements of Earnings |
|||||||||||
|
(Unaudited) |
|||||||||||
|
|
|
||||||||||
|
|
For the three months ended |
||||||||||
|
|
October 31, |
|
July 31, |
|
October 31, |
||||||
|
|
In millions, except per share amounts |
||||||||||
|
Net revenue |
$ |
7,871 |
|
|
$ |
6,951 |
|
|
$ |
7,354 |
|
|
Costs and expenses: |
|
|
|
|
|
||||||
|
Cost of sales |
|
5,278 |
|
|
|
4,555 |
|
|
|
4,935 |
|
|
Research and development |
|
515 |
|
|
|
509 |
|
|
|
502 |
|
|
Selling, general and administrative |
|
1,262 |
|
|
|
1,229 |
|
|
|
1,280 |
|
|
Amortization of intangible assets |
|
73 |
|
|
|
73 |
|
|
|
78 |
|
|
Impairment of goodwill (a) |
|
905 |
|
|
|
— |
|
|
|
— |
|
|
Transformation costs |
|
184 |
|
|
|
80 |
|
|
|
197 |
|
|
Disaster charges |
|
(1 |
) |
|
|
30 |
|
|
|
10 |
|
|
Acquisition, disposition and other related charges |
|
(6 |
) |
|
|
9 |
|
|
|
2 |
|
|
Total costs and expenses |
|
8,210 |
|
|
|
6,485 |
|
|
|
7,004 |
|
|
(Loss) earnings from operations |
|
(339 |
) |
|
|
466 |
|
|
|
350 |
|
|
Interest and other, net |
|
(109 |
) |
|
|
(74 |
) |
|
|
(106 |
) |
|
Tax indemnification and related adjustments |
|
(20 |
) |
|
|
(30 |
) |
|
|
5 |
|
|
Non-service net periodic benefit credit |
|
28 |
|
|
|
34 |
|
|
|
17 |
|
|
Litigation judgment |
|
— |
|
|
|
— |
|
|
|
2,351 |
|
|
Earnings from equity interests |
|
83 |
|
|
|
68 |
|
|
|
71 |
|
|
Pretax (loss) earnings |
|
(357 |
) |
|
|
464 |
|
|
|
2,688 |
|
|
Benefit (provision) for taxes |
|
53 |
|
|
|
(55 |
) |
|
|
(135 |
) |
|
Net (loss) earnings |
$ |
(304 |
) |
|
$ |
409 |
|
|
$ |
2,553 |
|
|
Net (loss) earnings per share: |
|
|
|
|
|
||||||
|
Basic |
$ |
(0.23 |
) |
|
$ |
0.31 |
|
|
$ |
1.95 |
|
|
Diluted |
$ |
(0.23 |
) |
|
$ |
0.31 |
|
|
$ |
1.91 |
|
|
Cash dividends declared per share |
$ |
0.12 |
|
|
$ |
0.12 |
|
|
$ |
0.12 |
|
|
Weighted-average shares used to compute net (loss) earnings per share: |
|
|
|
|
|
||||||
|
Basic |
|
1,296 |
|
|
|
1,305 |
|
|
|
1,312 |
|
|
Diluted |
|
1,296 |
|
|
|
1,323 |
|
|
|
1,335 |
|
|
HEWLETT PACKARD ENTERPRISE COMPANY AND SUBSIDIARIES |
|||||||
|
Condensed Consolidated Statements of Earnings |
|||||||
|
(Unaudited) |
|||||||
|
|
|
||||||
|
|
For the twelve months ended |
||||||
|
|
31 Ottobre 2022 |
|
31 Ottobre 2021 |
||||
|
|
In millions, except per share amounts |
||||||
|
Net revenue |
$ |
28,496 |
|
|
$ |
27,784 |
|
|
Costs and expenses: |
|
|
|
||||
|
Cost of sales |
|
18,990 |
|
|
|
18,408 |
|
|
Research and development |
|
2,045 |
|
|
|
1,979 |
|
|
Selling, general and administrative |
|
4,941 |
|
|
|
4,929 |
|
|
Amortization of intangible assets |
|
293 |
|
|
|
354 |
|
|
Impairment of goodwill (a) |
|
905 |
|
|
|
— |
|
|
Transformation costs |
|
473 |
|
|
|
930 |
|
|
Disaster charges |
|
48 |
|
|
|
16 |
|
|
Acquisition, disposition and other related charges |
|
19 |
|
|
|
36 |
|
|
Total costs and expenses |
|
27,714 |
|
|
|
26,652 |
|
|
Earnings from operations |
|
782 |
|
|
|
1,132 |
|
|
Interest and other, net |
|
(188 |
) |
|
|
(211 |
) |
|
Tax indemnification and related adjustments |
|
(67 |
) |
|
|
65 |
|
|
Non-service net periodic benefit credit |
|
134 |
|
|
|
70 |
|
|
Litigation judgment |
|
— |
|
|
|
2,351 |
|
|
Earnings from equity interests |
|
215 |
|
|
|
180 |
|
|
Pretax earnings |
|
876 |
|
|
|
3,587 |
|
|
Provision for taxes |
|
(8 |
) |
|
|
(160 |
) |
|
Net earnings |
$ |
868 |
|
|
$ |
3,427 |
|
|
Net earnings per share: |
|
|
|
||||
|
Basic |
$ |
0.67 |
|
|
$ |
2.62 |
|
|
Diluted |
$ |
0.66 |
|
|
$ |
2.58 |
|
|
Cash dividends declared per share |
$ |
0.48 |
|
|
$ |
0.48 |
|
|
Weighted-average shares used to compute net earnings per share: |
|
|
|
||||
|
Basic |
|
1,303 |
|
|
|
1,309 |
|
|
Diluted |
|
1,322 |
|
|
|
1,330 |
|
Contacts
Editorial contact
Laura Keller
Laura.Keller@hpe.com
Investor contact
Jeff Kvaal
investor.relations@hpe.com