

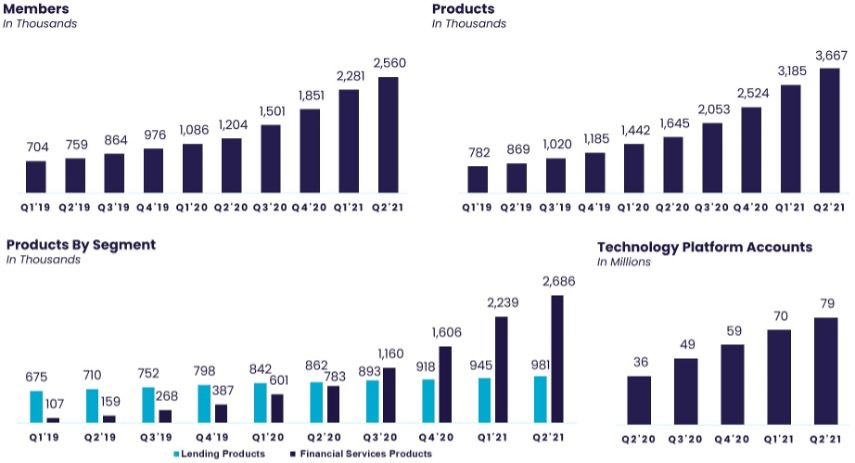
Total Year-over-Year Member Growth of 113% Accelerated for 8th Consecutive Quarter to 2.6 million
Total Products of 3.7 million Up 123% Year-over-Year
Record Quarterly Net Revenue Up 101% Year-over-Year and Adjusted Net Revenue Up 74% Year-over-Year
Successful Business Combination and Public Listing on Nasdaq
SAN FRANCISCO–(BUSINESS WIRE)–$SOFI–SoFi Technologies, Inc. (NASDAQ: SOFI), a member-centric, one-stop shop for digital financial services that allows members to borrow, save, spend, invest and protect their money, reported financial results today for its second quarter ended 30 Giugno 2021.
“The second quarter proved to be another quarter full of milestones for SoFi,” said Anthony Noto, CEO of SoFi. “We exceeded our financial expectations, delivering record adjusted quarterly net revenue and our fourth consecutive quarter of positive adjusted EBITDA. We drove our 8th straight quarter of accelerating member growth, with even faster growth in cross-buying from existing members, increased our Galileo account base to nearly 79 million, and raised nearly $2 billion in our successful transition to a public company. We accomplished all of this by focusing on our members and our mission to provide them with the right financial products, services, and advice for every major financial decision in their lives and every day in between.”
|
Consolidated results summary |
|||||||||||
|
|
Three Months Ended June 30, |
% Change |
|||||||||
|
($ in thousands) |
2021 |
2020 |
|||||||||
|
Consolidated – GAAP |
|
|
|
||||||||
|
Total net revenue |
$ |
231,274 |
|
$ |
114,952 |
|
101 |
% |
|||
|
Net income (loss) |
(165,314 |
) |
7,808 |
|
n/m |
||||||
|
|
|
|
|
||||||||
|
Consolidated – Non-GAAP |
|
|
|
||||||||
|
Adjusted net revenue(1) |
$ |
237,215 |
|
$ |
136,250 |
|
74 |
% |
|||
|
Adjusted EBITDA(1) |
11,240 |
|
(23,750 |
) |
n/m |
||||||
|
(1) |
|
Adjusted net revenue and adjusted EBITDA are non-GAAP financial measures. For more information and reconciliations to the most comparable GAAP measures, see “Non-GAAP Financial Measures” and Table 2 to the “Financial Tables” herein. |
Consolidated Results
Total GAAP net revenue of $231.3 million in the second quarter of 2021 was up 101% from the corresponding prior-year period. On an adjusted basis, net revenue for the second quarter of 2021 was $237.2 million, a record high and 74% higher than last year’s second quarter total of $136.3 million. Strength in all three of SoFi’s business segments drove the growth in these measures.
SoFi recorded a $165.3 million net loss for the second quarter of 2021, compared to net income of $7.8 million in last year’s second quarter. We remeasured our valuation allowance during 2020 as a result of the deferred tax liabilities recognized in connection with our acquisition of Galileo, which decreased the valuation allowance by $99.8 million. The absence of that tax benefit, together with significant non-cash stock-based compensation expenses and fair value changes in warrants primarily related to the fair market value of SoFi stock, were the largest contributors to the current period net loss.
Second quarter adjusted EBITDA of $11.2 million was positive for the fourth consecutive quarter, and $35.0 million higher than the second quarter of 2020, due to the combination of higher revenues across all business segments, partially offset by increased spending to achieve incremental growth.
The Company continued its trend of accelerating year-over-year growth in both members and total products in the second quarter. Total members grew 113% year-over-year to 2.6 million, up from 1.2 million at the same point last year, and total products grew 123% to 3.7 million at quarter end compared to 1.6 million at the same point last year. Growth in our member base and products was driven by significant expansion in the offering across business segments, particularly in the Financial Services segment, where growth in SoFi Invest and SoFi Money offerings more than tripled the number of Financial Services segment products, to nearly 2.7 million, up from approximately 783,000 at the same point last year. As of the end of the second quarter of 2021, Financial Services segment products were nearly three times the number of Lending products. Growth in personal and student loans largely drove the 14% year-over-year increase in Lending segment products. Technology Platform accounts increased by 119% in the second quarter of 2021, to nearly 79 million, due to both new client acquisition by Galileo and growth at its existing clients.
Lending Segment results
Lending segment net revenues of $166.3 million on a GAAP basis and $172.2 million on an adjusted basis for the second quarter of 2021 increased by 73% and 47%, respectively, year-over-year, driven by higher origination volume in every type of loan SoFi offers.
Lending segment contribution profit of $89.2 million increased 80% year-over-year in the second quarter of 2021, due to the combination of revenue growth and strategic balance sheet management.
|
Lending – Segment Results of Operations |
||||||||||||||||
|
|
Three Months Ended June 30, |
|
|
|||||||||||||
|
($ in thousands) |
2021 |
2020 |
Variance |
% Change |
||||||||||||
|
Total net revenue – Lending |
$ |
166,291 |
|
$ |
95,884 |
|
$ |
70,407 |
|
73 |
|
% |
||||
|
Servicing rights – change in valuation inputs or assumptions |
224 |
|
18,720 |
|
(18,496 |
) |
(99 |
) |
% |
|||||||
|
Residual interests classified as debt – change in valuation inputs or assumptions |
5,717 |
|
2,578 |
|
3,139 |
|
122 |
|
% |
|||||||
|
Directly attributable expenses |
(83,044 |
) |
(67,763 |
) |
(15,281 |
) |
23 |
|
% |
|||||||
|
Contribution Profit |
$ |
89,188 |
|
$ |
49,419 |
|
$ |
39,769 |
|
80 |
|
% |
||||
|
|
|
|
|
|
||||||||||||
|
Adjusted net revenue – Lending(1) |
$ |
172,232 |
|
$ |
117,182 |
|
$ |
55,050 |
|
47 |
|
% |
||||
|
(1) |
|
Adjusted net revenue – Lending represents a non-GAAP financial measure. For more information and a reconciliation to the most comparable GAAP measure, see “Non-GAAP Financial Measures” and Table 2 to the “Financial Tables” herein. |
In the second quarter of 2021, total origination volume in the Lending segment increased 66% year-over-year. While growth in student loans remains depressed relative to pre-COVID levels, low rates and improving U.S. economic trends have allowed SoFi to return to more normalized credit qualification standards. This led to an increase in personal and home loan funding volumes, which were up 188% and 49%, respectively, year-over-year.
|
Lending – Originations |
||||||||||||
|
|
Three Months Ended June 30, |
Variance |
% Change |
|||||||||
|
($ in thousands) |
2021 |
2020 |
||||||||||
|
Home loans |
$ |
792,228 |
$ |
532,323 |
$ |
259,905 |
49 |
% |
||||
|
Personal loans |
1,294,384 |
448,980 |
845,404 |
188 |
% |
|||||||
|
Student loans |
859,497 |
788,694 |
70,803 |
9 |
% |
|||||||
|
Total |
$ |
2,946,109 |
$ |
1,769,997 |
$ |
1,176,112 |
66 |
% |
||||
Despite various headwinds, SoFi has continued its trend of expanding its set of product offerings and features in the Lending segment. So far this year, SoFi has introduced a Rate Match Guarantee feature for student loans, as well as a “snooze” feature that allows borrowers to lock in current low rates on a new student loan without beginning payments until the suspension is lifted. In personal loans, we have refined our credit policy and automation capabilities, creating a faster, more accurate and lower-touch experience. More than 50% of personal loans processed in the second quarter of 2021 were fully automated, up from less than 30% one year ago, and we reduced time to fund by 50%, to two days. And in home loans, we introduced a new rates calculator to help borrowers find the right loan for them. The combination of these enhancements, the return to more normalized credit qualification standards, and increased marketing in a favorable rate environment, contributed to double-digit year-over-year growth across every loan type in the second quarter of 2021.
|
Lending – Products |
30 Giugno 2021 |
30 Giugno 2020 |
Variance |
% Change |
|||||
|
Home loans |
18,102 |
10,511 |
7,591 |
72 |
% |
||||
|
Personal loans |
544,068 |
474,581 |
69,487 |
15 |
% |
||||
|
Student loans |
419,270 |
376,878 |
42,392 |
11 |
% |
||||
|
Total lending products |
981,440 |
861,970 |
119,470 |
14 |
% |
||||
Financial Services Segment results
The Company has experienced significant growth in Financial Services net revenue this year, as members have responded positively to a steady stream of new offerings launched since 2019. Second quarter 2021 net revenue of $17.0 million compares to $2.4 million in the second quarter of 2020. The largest driver of the revenue increase was our SoFi Invest business, where we experienced a surge in new members and activity. Revenues from new equity capital markets and advisory services offerings we introduced during the quarter contributed as well, as did strength in SoFi Money and SoFi Lantern.
Second quarter Financial Services segment contribution loss of $24.7 million improved by $6.1 million from the prior year quarter loss of $30.9 million. Revenue growth of $14.6 million fueled by strength in the offerings referenced above more than offset the $8.5 million year-over-year increase in expenses driven by ongoing investment to grow this business. At the same time, we are executing efficiently on our long-term strategy to increase member adoption of multiple products across segments, which reduces customer acquisition costs and ultimately drives higher lifetime value per member.
|
Financial Services – Segment Results of Operations |
||||||||||||||||
|
|
Three Months Ended June 30, |
|
|
|||||||||||||
|
($ in thousands) |
2021 |
2020 |
Variance |
% Change |
||||||||||||
|
Total net revenue |
$ |
17,039 |
|
$ |
2,428 |
|
$ |
14,611 |
|
602 |
|
% |
||||
|
Directly attributable expenses |
(41,784 |
) |
(33,321 |
) |
(8,463 |
) |
25 |
|
% |
|||||||
|
Contribution loss |
$ |
(24,745 |
) |
$ |
(30,893 |
) |
$ |
6,148 |
|
(20 |
) |
% |
||||
By continuously innovating for members with new and relevant offerings, features and rewards, SoFi has more than tripled the number of Financial Services products in the past year, to 2.7 million in total. For our SoFi Money offering, we added a two-day early paycheck feature to an already competitive direct deposit program that includes free overdraft protection and roundups. An innovative personal loan/SoFi Money bundle that offers a rate cut on personal loans paid by direct deposit also drove meaningful account growth over the past year. In our SoFi Invest offering, in addition to expanding our crypto and fractional share trading offerings, the Company launched a first-of-its-kind equity ETF that pays weekly dividends. In our new SoFi Credit Card business, accounts, balances and average spend have all grown substantially since we introduced an innovative rewards program earlier this year, where members have already redeemed 450 million points across SoFi products. In our SoFi Relay offering, we have experienced a surge of new members signing up for free credit score monitoring through the app this year, and opportunities for new SoFi At Work partnerships have grown as companies contemplate post-COVID benefit packages for employees.
|
Financial Services – Products |
30 Giugno 2021 |
30 Giugno 2020 |
Variance |
% Change |
|||||
|
Money |
954,519 |
220,201 |
734,318 |
333 |
% |
||||
|
Invest |
1,038,570 |
328,837 |
709,733 |
216 |
% |
||||
|
Credit Card |
42,744 |
— |
42,744 |
n/m |
|||||
|
Relay |
626,195 |
227,201 |
398,994 |
176 |
% |
||||
|
At Work |
23,653 |
6,835 |
16,818 |
246 |
% |
||||
|
Total products |
2,685,681 |
783,074 |
1,902,607 |
243 |
% |
||||
Technology Platform Segment results
SoFi’s Technology Platform segment consists primarily of Galileo Financial Technologies, a technology infrastructure provider we acquired in May 2020. Already a leader in the internet-only neobanks space with a substantial market share, Galileo is increasingly expanding into non-financial sectors as well. Over the past year, Galileo more than doubled its number of accounts, to nearly 79 million from 36 million, through growth in both new and existing clients.
|
Technology Platform |
30 Giugno 2021 |
30 Giugno 2020 |
Variance |
% Change |
|||||
|
Total accounts |
78,902,156 |
35,988,090 |
42,914,066 |
119 |
% |
||||
Total net revenue of $45.3 million for the second quarter of 2021 was up 138% year on year, which reflects a full quarter of operations in 2021 compared to a partial quarter in 2020 subsequent to our acquisition of Galileo. SoFi has used the first year since acquisition to position the business for future growth, investing heavily to move operations from an on-premise environment to the Cloud, nearly double headcount and expand to new geographies. This has caused a significant increase in expenses and slower growth in contribution profit, which was up 8% during the period.
|
Technology Platform – Segment Results of Operations |
||||||||||||
|
|
Three Months Ended June 30, |
|
|
|||||||||
|
($ in thousands) |
2021 |
2020 |
Variance |
% Change |
||||||||
|
Total net revenue |
$ |
45,297 |
$ |
19,019 |
$ |
26,278 |
138 |
% |
||||
|
Directly attributable expenses |
(32,284) |
(6,919) |
(25,365) |
367 |
% |
|||||||
|
Contribution Profit |
$ |
13,013 |
$ |
12,100 |
913 |
8 |
% |
|||||
Recent Events
Social Finance, Inc. (Social Finance) entered into a merger agreement (the Agreement) with Social Capital Hedosophia Holdings Corp. V (SCH) on 7 Gennaio 2021. The transactions contemplated by the terms of the Agreement were completed on 28 Maggio 2021, in conjunction with which SCH changed its name to SoFi Technologies, Inc. The transactions contemplated in the Agreement are collectively referred to as the Business Combination.
Guidance and Outlook
Second quarter 2021 adjusted net revenue of $237 million exceeded quarterly guidance of $215 million to $220 million by 10% at the low end and 8% at the high end. Adjusted EBITDA of $11 million for the quarter exceeded quarterly guidance of $(8) million to $2 million by $19 million at the low end and $9 million at the high end.
Management expects continued strong growth in the third quarter of 2021, with expected adjusted net revenue of $245 million to $255 million and expected adjusted EBITDA of $(7) million to $3 million. Management reiterates its full-year 2021 guidance of adjusted net revenue of $980 million and adjusted EBITDA of $27 million. This is despite lowering our expectations for student loan refinancing revenue by $40 million, due to the extension of the CARES Act moratorium on student loan payments from 30 Settembre 2021 to 31 Gennaio 2022, and reducing our Technology Platform revenue estimate by $12 million due to the minority stake in Apex being bought back. Management will further address third quarter and full-year 2021 guidance on the quarterly earnings conference call.
Earnings Webcast
SoFi’s executive management team will host a live audio webcast beginning at 5:00 p.m. Eastern Time (2:00 p.m. Pacific Time) today to discuss the quarter’s financial results and business highlights. All interested parties are invited to listen to the live webcast at https://investors.sofi.com. A replay of the webcast will be available on the SoFi Investor Relations website for 30 days. Investor information, including supplemental financial information, is available on SoFi’s Investor Relations website at https://investors.sofi.com.
Cautionary Statement Regarding Forward-Looking Statements
Certain of the statements above are forward-looking and as such are not historical facts. This includes, without limitation, statements regarding the financial position, business strategy and the plans and objectives of management for our future operations. These forward-looking statements are not guarantees of performance. Such statements can be identified by the fact that they do not relate strictly to historical or current facts. Words such as “anticipate”, “believe”, “continue”, “could”, “estimate”, “expect”, “intend”, “may”, “opportunity”, “future”, “strategy”, “might”, “plan”, “possible”, “potential”, “predict”, “project”, “should”, “strive”, “would”, “will be”, “will continue”, “will likely result” and similar expressions may identify forward-looking statements, but the absence of these words does not mean that a statement is not forward-looking. Factors that could cause actual results to differ materially from those contemplated by these forward-looking statements include: (i) the effect of and uncertainties related to the COVID-19 pandemic (including any government responses thereto); (ii) our ability to achieve and maintain profitability in the future; (iii) the impact on our business of the regulatory environment and complexities with compliance related to such environment; (iv) our ability to become a bank holding company and acquire a national bank charter; (v) our ability to respond to general economic conditions; (vi) our ability to manage our growth effectively and our expectations regarding the development and expansion of our business; (vii) our ability to access sources of capital, including debt financing and other sources of capital to finance operations and growth; (viii) the success of our marketing efforts and our ability to expand our member basis; (ix) our ability to grow market share in existing markets or any new markets we may enter; (x) our ability to develop new products, features and functionality that are competitive and meet market needs; (xi) our ability to realize the benefits of our strategy, including what we refer to as our financial services productivity loop; (xii) our ability to make accurate credit and pricing decisions or effectively forecast our loss rates; (xiii) our ability to establish and maintain an effective system of internal controls over financial reporting; (xiv) our ability to maintain the listing of our securities on Nasdaq; (xv) our ability to realize the anticipated benefits of the Business Combination; and (xvi) the outcome of any legal or governmental proceedings that may be instituted against us. The foregoing list of factors is not exhaustive. You should carefully consider the foregoing factors and the other risks and uncertainties set forth in the section titled “Risk Factors” in the final proxy/prospectus for our recently completed Business Combination, as filed with the Securities and Exchange Commission, and those that are included in any of our future filings with the SEC, including our periodic reports under the Exchange Act.
These forward-looking statements are based on information available as of the date hereof and current expectations, forecasts and assumptions, and involve a number of judgments, risks and uncertainties. Accordingly, forward-looking statements should not be relied upon as representing our views as of any subsequent date, and we do not undertake any obligation to update forward-looking statements to reflect events or circumstances after the date they were made, whether as a result of new information, future events or otherwise, except as may be required under applicable securities laws.
As a result of a number of known and unknown risks and uncertainties, our actual results or performance may be materially different from those expressed or implied by these forward-looking statements. You should not place undue reliance on these forward-looking statements.
Non-GAAP Financial Measures
This press release presents information about our adjusted net revenue and adjusted EBITDA, which are non-GAAP financial measures provided as supplements to the results provided in accordance with accounting principles generally accepted in the United States (GAAP). We use adjusted net revenue and adjusted EBITDA to evaluate our operating performance, formulate business plans, help better assess our overall liquidity position, and make strategic decisions, including those relating to operating expenses and the allocation of internal resources. Accordingly, we believe that adjusted net revenue and adjusted EBITDA provide useful information to investors and others in understanding and evaluating our operating results in the same manner as our management. These non-GAAP measures are presented for supplemental informational purposes only, have limitations as analytical tools, and should not be considered in isolation from, or as a substitute for, the analysis of other GAAP financial measures, such as total net revenue and net income (loss). Other companies may not use these non-GAAP measures or may use similar measures that are defined in a different manner. Therefore, SoFi’s non-GAAP measures may not be directly comparable to similarly titled measures of other companies. Reconciliations of these non-GAAP measures to the most directly comparable GAAP financial measures are provided in Table 2 to the “Financial Tables” herein.
Forward-looking non-GAAP financial measures are presented without reconciliations of such forward-looking non-GAAP measures because the GAAP financial measures are not accessible on a forward-looking basis and reconciling information is not available without unreasonable effort due to the inherent difficulty in forecasting and quantifying certain amounts that are necessary for such reconciliations, including adjustments reflected in our reconciliation of historic non-GAAP financial measures, the amounts of which, based on historical experience, could be material.
About SoFi
SoFi’s mission is to help people achieve financial independence to realize their ambitions. Our products for borrowing, saving, spending, investing and protecting give our more than two million members fast access to tools to get their money right. SoFi membership comes with the key essentials for getting ahead, including career advisors and connection to a thriving community of like-minded, ambitious people. SoFi is also the naming rights partner of SoFi Stadium, home of the Los Angeles Chargers and the Los Angeles Rams. For more information, visit https://www.sofi.com or download our iOS and Android apps.
Availability of Other Information About SoFi
Investors and others should note that we communicate with our investors and the public using our website (www.sofi.com), the investor relations website (https://investors.sofi.com), and on social media (Twitter and LinkedIn), including but not limited to investor presentations and investor fact sheets, U.S. Securities and Exchange Commission filings, press releases, public conference calls and webcasts. The information that SoFi posts on these channels and websites could be deemed to be material information. As a result, SoFi encourages investors, the media, and others interested in SoFi to review the information that is posted on these channels, including the investor relations website, on a regular basis. This list of channels may be updated from time to time on SoFi’s investor relations website and may include additional social media channels. The contents of SoFi’s website or these channels, or any other website that may be accessed from its website or these channels, shall not be deemed incorporated by reference in any filing under the Securities Act of 1933, as amended.
FINANCIAL TABLES
1. Condensed Consolidated Statements of Operations and Comprehensive Income (Loss) (unaudited)
2. Reconciliation of GAAP to Non-GAAP Financial Measures
3. Condensed Consolidated Balance Sheets (unaudited)
4. Condensed Consolidated Statements of Cash Flows (unaudited)
5. Company Metrics
6. Segment Financials
|
Table 1 |
||||||||||||||||
|
SoFi Technologies, Inc. Unaudited Condensed Consolidated Statements of Operations and Comprehensive Income (Loss) (In Thousands, Except for Share and Per Share Data) |
||||||||||||||||
|
|
Three Months Ended June 30, |
Six Months Ended June 30, |
||||||||||||||
|
|
2021 |
2020 |
2021 |
2020 |
||||||||||||
|
Interest income |
|
|
|
|
||||||||||||
|
Loans |
$ |
79,678 |
|
$ |
77,485 |
|
$ |
156,899 |
|
$ |
163,601 |
|
||||
|
Securitizations |
3,794 |
|
6,500 |
|
8,261 |
|
13,561 |
|
||||||||
|
Related party notes |
— |
|
879 |
|
211 |
|
1,931 |
|
||||||||
|
Other |
636 |
|
1,201 |
|
1,265 |
|
4,254 |
|
||||||||
|
Total interest income |
84,108 |
|
86,065 |
|
166,636 |
|
183,347 |
|
||||||||
|
Interest expense |
|
|
|
|
||||||||||||
|
Securitizations and warehouses |
26,250 |
|
39,678 |
|
56,058 |
|
87,201 |
|
||||||||
|
Corporate borrowings |
1,378 |
|
3,416 |
|
6,386 |
|
4,504 |
|
||||||||
|
Other |
468 |
|
224 |
|
900 |
|
1,746 |
|
||||||||
|
Total interest expense |
28,096 |
|
43,318 |
|
63,344 |
|
93,451 |
|
||||||||
|
Net interest income |
56,012 |
|
42,747 |
|
103,292 |
|
89,896 |
|
||||||||
|
Noninterest income |
|
|
|
|
||||||||||||
|
Loan origination and sales |
109,719 |
|
62,958 |
|
220,064 |
|
167,213 |
|
||||||||
|
Securitizations |
(26 |
) |
7,350 |
|
(2,062 |
) |
(75,754 |
) |
||||||||
|
Servicing |
(224 |
) |
(18,720 |
) |
(12,333 |
) |
(11,661 |
) |
||||||||
|
Technology Platform fees |
44,950 |
|
16,202 |
|
90,609 |
|
16,202 |
|
||||||||
|
Other |
20,843 |
|
4,415 |
|
27,688 |
|
7,358 |
|
||||||||
|
Total noninterest income |
175,262 |
|
72,205 |
|
323,966 |
|
103,358 |
|
||||||||
|
Total net revenue |
231,274 |
|
114,952 |
|
427,258 |
|
193,254 |
|
||||||||
|
Noninterest expense |
|
|
|
|
||||||||||||
|
Technology and product development |
69,389 |
|
47,833 |
|
135,337 |
|
88,004 |
|
||||||||
|
Sales and marketing |
94,951 |
|
64,267 |
|
182,185 |
|
126,937 |
|
||||||||
|
Cost of operations |
60,624 |
|
41,408 |
|
118,194 |
|
74,065 |
|
||||||||
|
General and administrative |
171,216 |
|
53,404 |
|
332,913 |
|
102,518 |
|
||||||||
|
Provision for credit losses |
486 |
|
— |
|
486 |
|
— |
|
||||||||
|
Total noninterest expense |
396,666 |
|
206,912 |
|
769,115 |
|
391,524 |
|
||||||||
|
Loss before income taxes |
(165,392 |
) |
(91,960 |
) |
(341,857 |
) |
(198,270 |
) |
||||||||
|
Income tax (expense) benefit |
78 |
|
99,768 |
|
(1,021 |
) |
99,711 |
|
||||||||
|
Net income (loss) |
$ |
(165,314 |
) |
$ |
7,808 |
|
$ |
(342,878 |
) |
$ |
(98,559 |
) |
||||
|
Other comprehensive income (loss) |
|
|
|
|
||||||||||||
|
Foreign currency translation adjustments, net |
(266 |
) |
(36 |
) |
(346 |
) |
(43 |
) |
||||||||
|
Total other comprehensive loss |
(266 |
) |
(36 |
) |
(346 |
) |
(43 |
) |
||||||||
|
Comprehensive income (loss) |
$ |
(165,580 |
) |
$ |
7,772 |
|
$ |
(343,224 |
) |
$ |
(98,602 |
) |
||||
|
Loss per share |
|
|
|
|
||||||||||||
|
Loss per share – basic |
$ |
(0.48 |
) |
$ |
(0.03 |
) |
$ |
(1.50 |
) |
$ |
(1.68 |
) |
||||
|
Loss per share – diluted |
$ |
(0.48 |
) |
$ |
(0.03 |
) |
$ |
(1.50 |
) |
$ |
(1.68 |
) |
||||
|
Weighted average common stock outstanding – basic |
365,036,365 |
|
72,147,293 |
|
241,282,003 |
|
70,768,457 |
|
||||||||
|
Weighted average common stock outstanding – diluted |
365,036,365 |
|
72,147,293 |
|
241,282,003 |
|
70,768,457 |
|
||||||||
Contacts
Investors:
Andrea Prochniak
SoFi Investor Relations
aprochniak@sofi.org
Media:
Rachel Rosenzweig
SoFi Media Relations
pr@sofi.com


